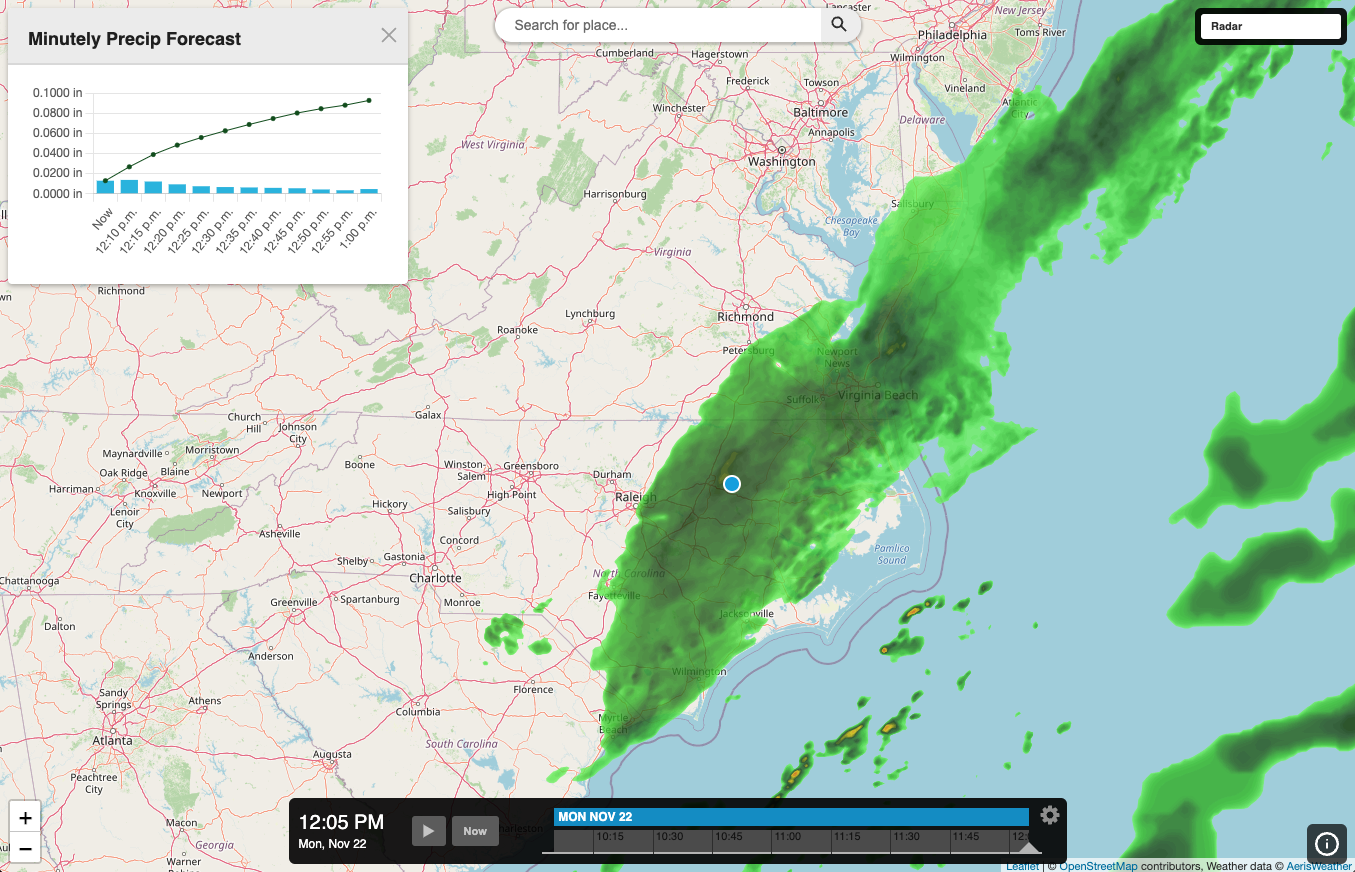
JavaScript SDK - Plotting Minutely Precip Data in the Interactive Map App Info Panel
The following example will demonstrate how to access minutely precip data upon clicking and plot that data in the info panel using Chart.js.
<!DOCTYPE html>
<html>
<head>
    <meta charset="UTF-8">
    <title>Xweather JavaScript SDK - Interactive Map App w/Custom Info Panel</title>
    <script defer src="https://cdn.aerisapi.com/sdk/js/latest/aerisweather.min.js"></script>
    <link rel="stylesheet" href="https://cdn.aerisapi.com/sdk/js/latest/aerisweather.css">
    <script src="https://cdn.jsdelivr.net/npm/chart.js/dist/chart.min.js"></script>
    <script src="https://cdn.jsdelivr.net/npm/chartjs-adapter-date-fns/dist/chartjs-adapter-date-fns.bundle.min.js"></script>
    <style>
        html,
        body {
                height: 100%;
                margin: 0;
                padding: 0;
                width: 100%;
            }
        #app {
            font-family: 'Helvetica','Arial',sans-serif;
            height: 100%;
            margin: 0;
            width: 100%;
        }
        .chart {
                width: 100%;
                height: 100%;
        }
    </style>
</head>
<body>
<div id="app"></div>
<script>

    let myChart;
    const createChart = (aeris, e) => {
        let precipArray;
        let timeArray;
        let precipAccum = 0.0;
        let precipAccumArray = [];
        let config;

        const chartColors = {
            precip: 'rgb(48, 187, 225)',
            precipAccum: 'rgb(15, 86, 30)',
        };
        const {lat, lon} = e.data.coord;
        console.log(lat,lon);
        const request = aeris.api()
                .endpoint('conditions')
                .place(`${lat},${lon}`)
                .format('json')
                .filter('minutelyprecip,5min');

            request.get().then((result) => {
                const data = result.data[0];
                const {periods} = data;
                precipArray = data.periods.map(element => {
                    precipAccum = precipAccum + element.precipIN;
                    precipAccumArray.push(precipAccum);
                    return element.precipIN;
                });
                timeArray = data.periods.map(element => element.dateTimeISO);

                //chart.js config
                config = {
                    type: 'bar',
                    data: {
                        //x-axes labels dataset
                        labels: timeArray,
                        //y-axes datasets
                        datasets: [{
                                label: "Precip",
                                backgroundColor: chartColors.precip,
                                pointBackgroundColor: chartColors.precip,
                                data: precipArray,
                                fill: false,
                                order: 1,

                            },
                            {
                                label: "Precip Accum",
                                backgroundColor: chartColors.precipAccum,
                                borderWidth: 1,
                                pointBackgroundColor: chartColors.precipAccum,
                                borderColor: chartColors.precipAccum,
                                data: precipAccumArray,
                                fill: false,
                                order: 0,
                                type: 'line'
                            }
                        ]
                    },
                    options: {
                        elements: {
                            line: {
                                borderWidth: 1
                            },
                            point: {
                                radius: 2
                            }
                        },
                        plugins: {
                            legend: {
                            display: false,
                            position: 'bottom'
                            },
                            tooltip: {
                                callbacks: {
                                    label: function(value) {
                                        return `${value.dataset.label}: ${value.formattedValue} in`;
                                    },
                                }
                            }
                        },
                        responsive: true,
                        interaction: {
                            mode: 'x'
                        },
                        scales: {
                            x: {
                                type: 'time',
                                display: true,
                                stacked: true,
                                time: {
                                    tooltipFormat: "MMM d, yyyy h:mm a",
                                    displayFormats: {
                                        hour: 'MMM yyyy'
                                    },
                                },
                                grid: {
                                    drawTicks: true,
                                    drawOnChartArea: false,
                                },
                                ticks: {
                                    drawTicks: true,
                                    source: 'data',
                                    callback: function(value, index, values) {
                                        if (index === 0) {
                                            value = 'Now';
                                        }
                                        return value;
                                    }
                                },
                            },
                            y: {
                                display: true,
                                ticks: {
                                    callback: function(value) {
                                        return `${value.toFixed(4)} in`;
                                    },
                                }
                            }
                        }
                    }
                };
                let ctx = document.getElementById("chartcanvas").getContext('2d');
                if( myChart) {
                    myChart.destroy();
                }
                myChart = new Chart(ctx, config);
            });
    };

    window.onload = () => {

        const aeris = new AerisWeather('CLIENT_ID', 'CLIENT_SECRET');
        const utils = aeris.utils;

        aeris.apps().then((apps) => {
            const app = new apps.InteractiveMapApp('#app', {
                map: {
                    strategy: 'leaflet',
                    zoom: 4,
                    layers: 'radar-global'
                },
                panels: {
                    layers: {
                        buttons: [{
                            id: 'radar-global',
                            value: 'radar-global:80',
                            title: 'Radar'
                        }]
                    }
                }
            });
            app.on("ready", () => {
                const plotInfo = {
                        views: [
                            {
                                data: (data) => {
                                    if (data && Object.keys(data).length === 0 && data.constructor === Object) {
                                        return;
                                    }
                                    return data;
                                },
                                renderer: (data) => {
                                    return (`
                                    <div class="chart"><canvas id="chartcanvas"></canvas></div>
                                    `);
                                },
                            }
                        ]
                };

                app.panels.info.setContentView('minutelyPrecip', plotInfo);
                app.map.on("click", (e) => {
                    console.log(e);
                    //Show our custom view which will render the div where
                    //our chart will reside
                    app.showInfoAtCoord(e.data.coord,'minutelyPrecip', "Minutely Precip Forecast");
                    //Set up chart and create new instance
                    createChart(aeris, e);
                });
            })
        });
    }
</script>

</body>
</html>