MapsGL - Filtering Data
When working with data on your map, you may want to filter the data to only show relevant information for your particular use case. There are different ways to filter data in MapsGL depending on the type of data you are working with.
Filtering Raster Data
When working with raster data, only layers associated with encoded raster data sources can be filtered.
To filter encoded raster data, simply adjust the minimum and maximum values of the layer’s drawRange property, which is an option of the sample paint style configuration. The values you provide for drawRange will determine the range of values that will be displayed for that layer on the map. These values must be within the range of the data source’s min and max values and in the same units as the data source.
Filtering Raster Weather Data
Filtering raster weather data is a common use case when you want to display only a subset of the data on the map. In this case, you just need to override the default paint style’s drawRange values in the weather layer’s overrides object when adding the layer to the map.
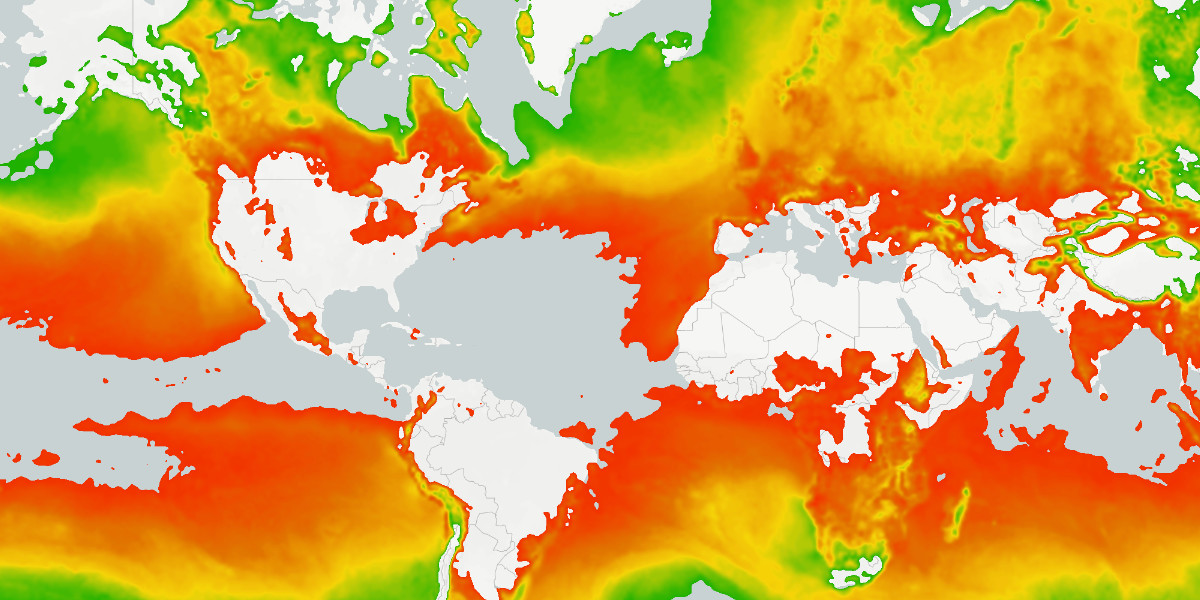
For example, if you wanted to filter the temperatures layer to only show values between 50°F and 80°F, you would need to convert the range to degrees Celsius as that is what temperature data is stored as in the data source. The following would be the appropriate configuration for this type of filter:
const FtoC = (f) => (f - 32) * 5 / 9;

controller.addWeatherLayer('temperatures', {
    paint: {
        sample: {
            drawRange: { min: FtoC(50), max: FtoC(80) }
        }
    }
});
The above code will give you a result where only temperatures between 10°C and 26.67°C are displayed on the map:
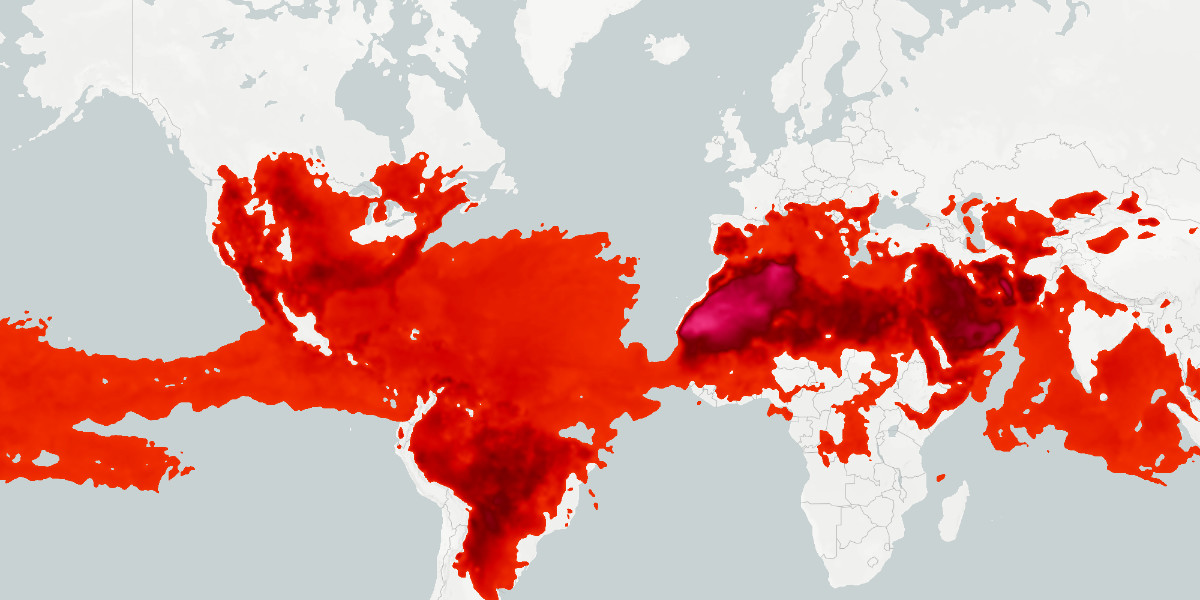
Alternatively, you can also filter the data by only specifying either a minimum or maximum value for drawRange and the other value will be set to the data source’s min or max value, respectively. For example, if you wanted to only show temperatures above 80°F, you just need to set the drawRange.min value:
controller.addWeatherLayer('temperatures', {
    paint: {
        sample: {
            drawRange: { min: FtoC(80) }
        }
    }
});
Similarly, you can show temperatures below 50°F by setting the drawRange.max value:
controller.addWeatherLayer('temperatures', {
    paint: {
        sample: {
            drawRange: { max: FtoC(50) }
        }
    }
});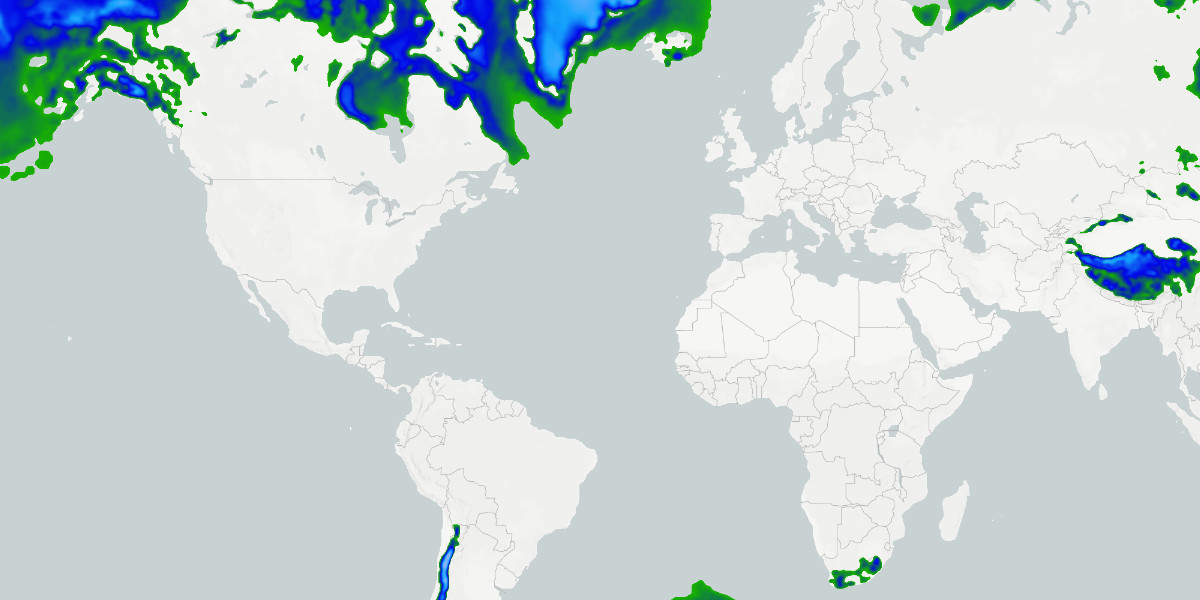
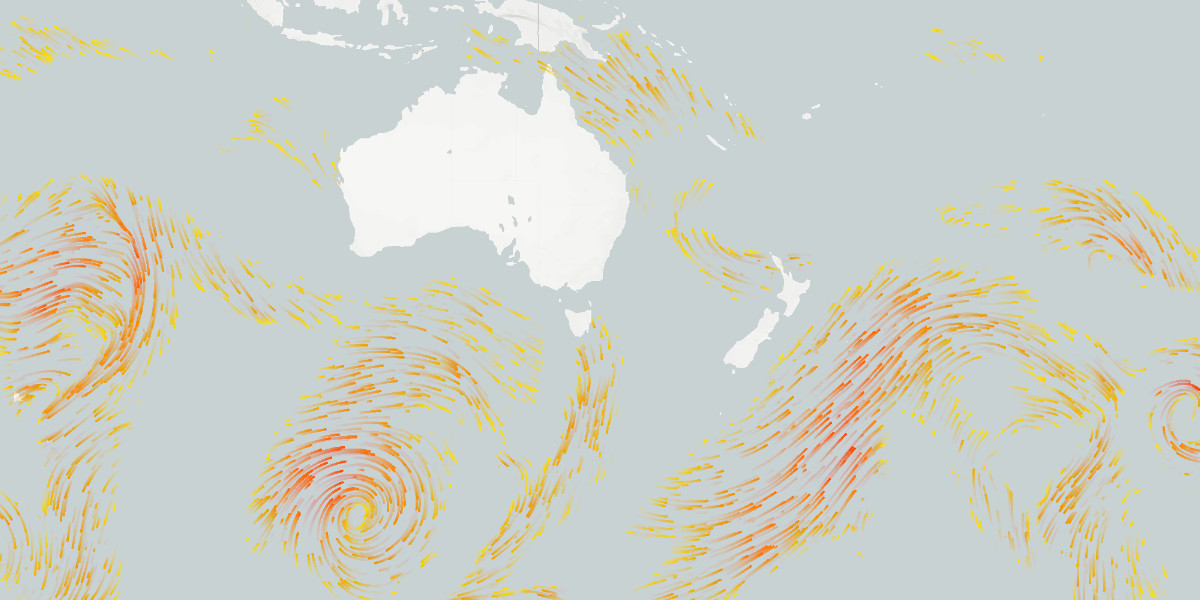
Since filtering is supported for all layers associated with encoded raster data sources, you can apply the same filtering techniques described above to layers rendered with other styles such as the wind speed particles layer. In this case, wind speed is stored in meters per second (m/s) in the data source, so you would need to convert the drawRange values to m/s as well:
const mphToMs = (mph) => mph * 0.44704;

controller.addWeatherLayer('wind-particles', {
    paint: {
        sample: {
            drawRange: { min: mphToMs(20) }
        }
    }
});
Filtering Vector Data
Vector data, which includes data from GeoJSON or vector tile sources, can be filtered using the filter property on a layer’s configuration. The filter option allows you to specify a set of conditions that must be met for a feature to be rendered on the map. These conditions are defined using logical expressions that evaluate the properties of each feature against specified values. Only features that satisfy the filter conditions will be displayed on the map, allowing you to focus on specific subsets of your vector data.
Refer to the expressions reference for more information on how to construct expressions for filtering vector data.
For pre-configured built-in weather layers, you can filter vector layers by setting the filter property in the weather layer’s overrides object.
Vector data filters are defined using a variety of operators and expressions to filter data based on properties and their values associated with a vector feature. So in order to filter vector data, you need to know the properties of the data you are working with.
For example, if you set up a data source of cities from Natural Earth and wanted to filter the cities layer to only show cities with a population greater than 1 million, you would need to know the name of the property that stores the population data from the GeoJSON source. Each Natural Earth feature in the cities dataset contains information about the population of the city in the POP_MAX property:
{
    "type": "Feature",
    "properties": {
        "SCALERANK": 1,
        "LABELRANK": 1,
        "FEATURECLA": "Populated place",
        "NAME": "Houston",
        "SOV0NAME": "United States",
        "SOV_A3": "USA",
        "ADM0NAME": "United States of America",
        "ADM0_A3": "USA",
        "ADM1NAME": "Texas",
        "ISO_A2": "US",
        "LATITUDE": 29.82192,
        "LONGITUDE": -95.341925,
        "POP_MAX": 4459000,
        "POP_MIN": 3647574,
        "POP_OTHER": 3607616,
        "RANK_MAX": 12,
        "RANK_MIN": 12
    },
    "geometry": {
        "type": "Point",
        "coordinates": [
            -95.348436,
            29.741273
        ]
    }
}
You would then set up a “greater than” logical expression as your filter to only show cities with a population greater than 1 million:
controller.addLayer('cities', {
    type: 'circle',
    source: 'cities',
    paint: {
        fill: {
            color: '#4E00C1'
        },
        circle: {
            radius: 6
        }
    },
    filter: ['>', ['get', 'POP_MAX'], 1000000]
});
You can also combine multiple expressions to create more complex filters that meet your specific needs.
For example, you have added a custom vector tile set consisting OpenStreetMap road data and you want to create a layer only showing bridges from that dataset. You can add a filter that uses the all expression to check if a road feature’s brunnel property is equal to bridge and the class property is equal to one of the values motorway, trunk, or primary, which are the classes of roads we’re interested in:
controller.addLayer('roads', {
    type: 'line',
    source: 'roads',
    paint: {
        line: {
            color: '#FF0000',
            width: 2
        }
    },
    filter: ['all',
        ['==', ['get', 'brunnel'], 'bridge'],
        ['in', ['get', 'class'], ['literal', ['motorway', 'trunk', 'primary']]]
    ]
});
Filtering Vector Weather Data
When it comes to filtering vector weather data, you would use the same set of logical expressions as outlined above. But since you aren’t configuring these layers, you would instead provide your filter conditions in the weather layer’s overrides object.
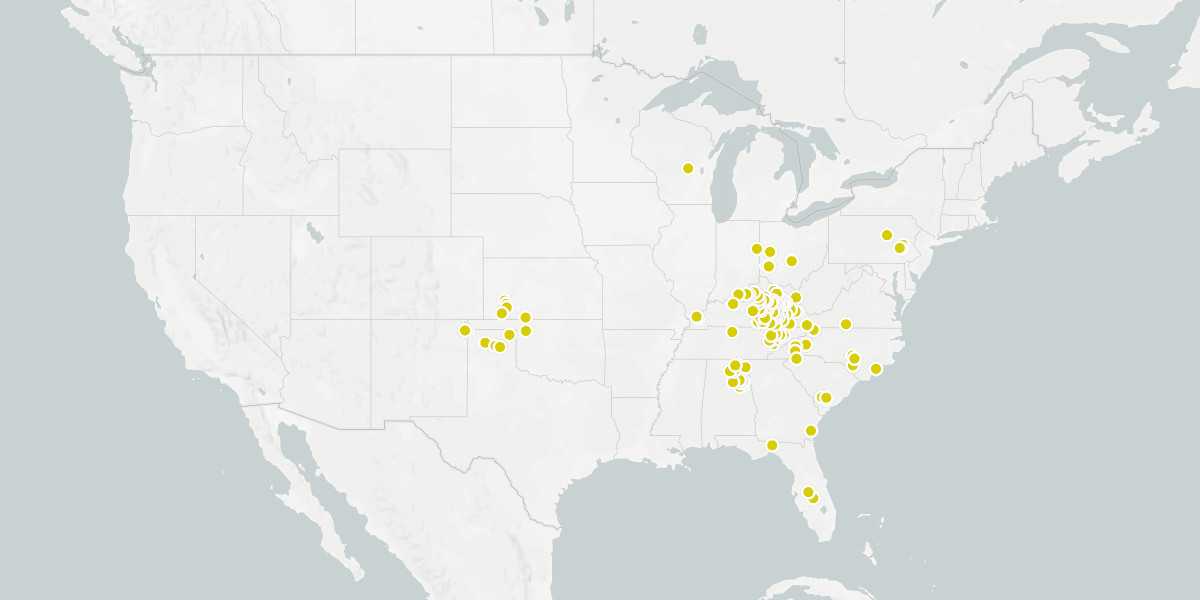
For example, if you wanted to filter the stormreports layer to only show reports of wind, you would set the filter in the overrides object when adding the layer to the map:
controller.addWeatherLayer('stormreports', {
    filter: ['==', ['get', 'report.cat'], 'wind']
});
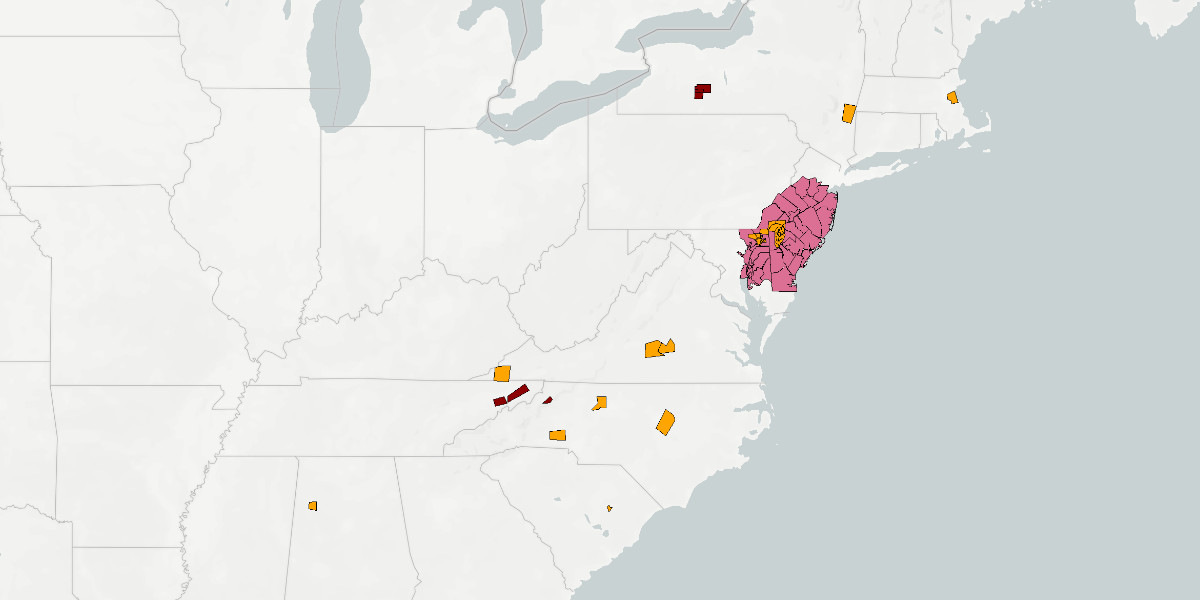
Filtering weather alerts based on category is another common use case for displaying weather data. For the alerts layer, you can easily filter alerts based on their VTEC codes so that only certain ones are displayed. For example, you only want to show severe thunderstorm warnings:
controller.addWeatherLayer('alerts', {
    filter: ['==', ['get', 'VTEC'], 'SV.W']
});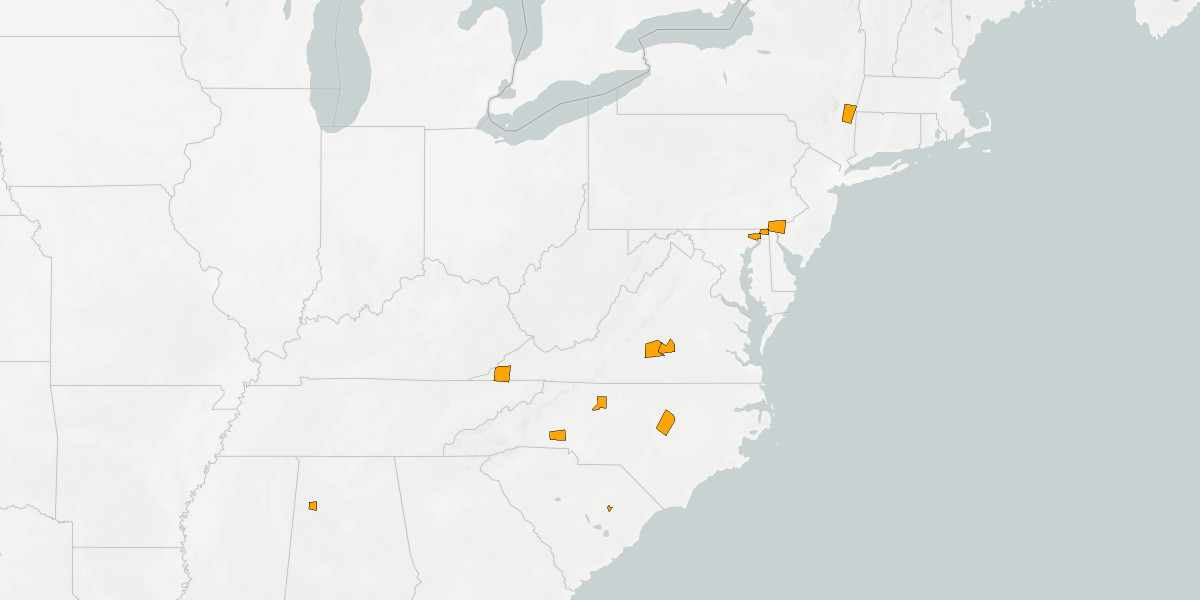
You can use the in expression to filter alerts based on multiple VTEC codes, such as a “severe” category that includes severe thunderstorm and tornado watches and warnings:
controller.addWeatherLayer('alerts', {
    filter: ['in', ['get', 'VTEC'], ['SV.A', 'SV.W', 'TO.A', 'TO.W']]
});