Data Operations
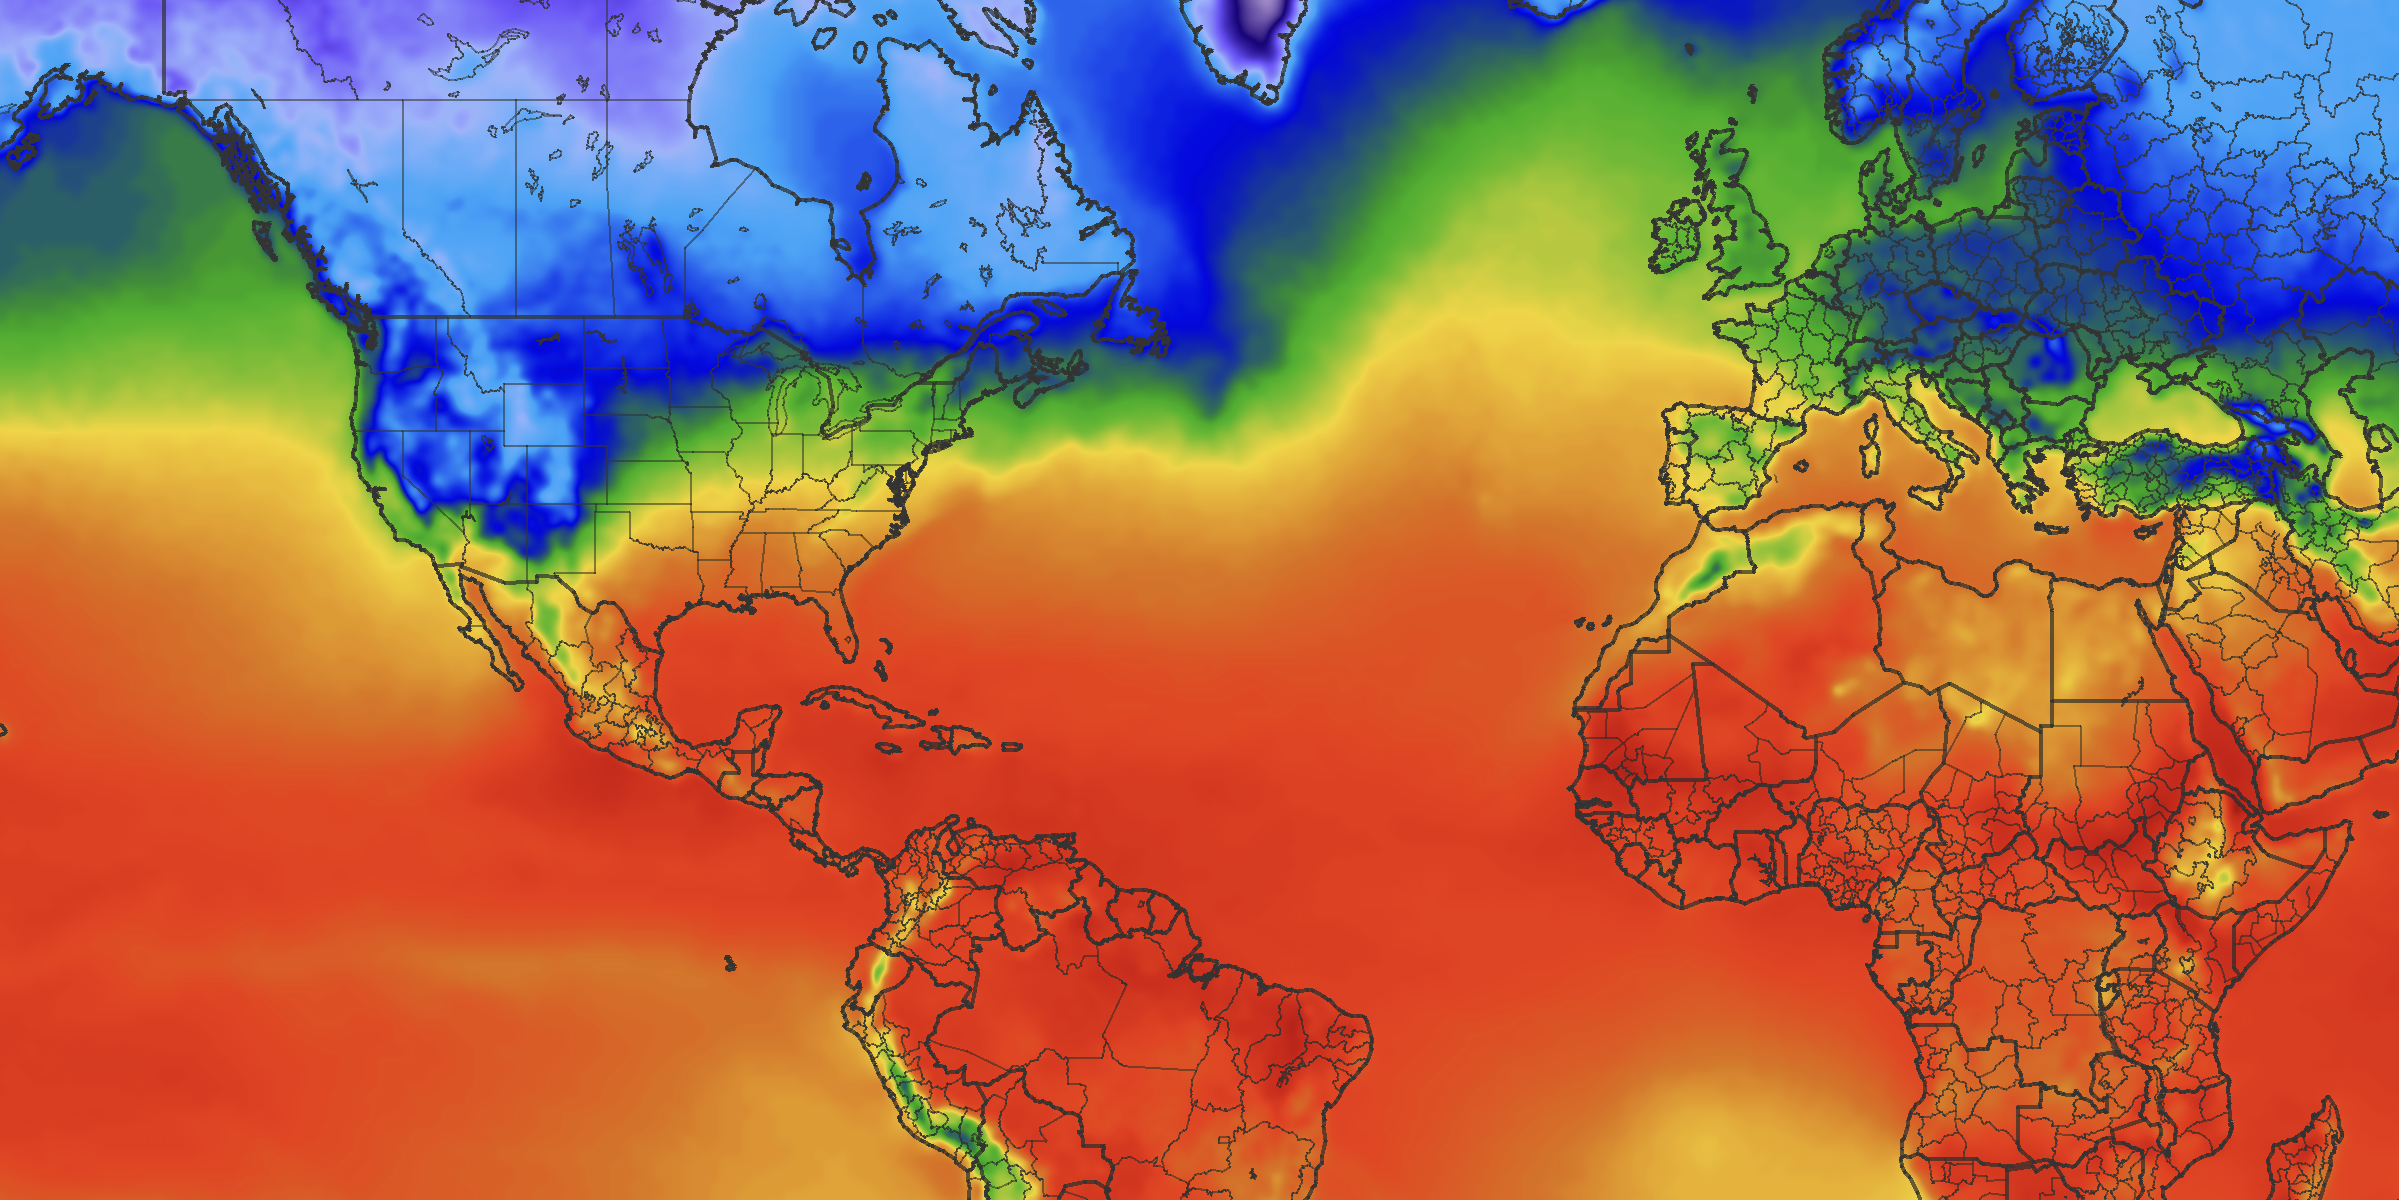
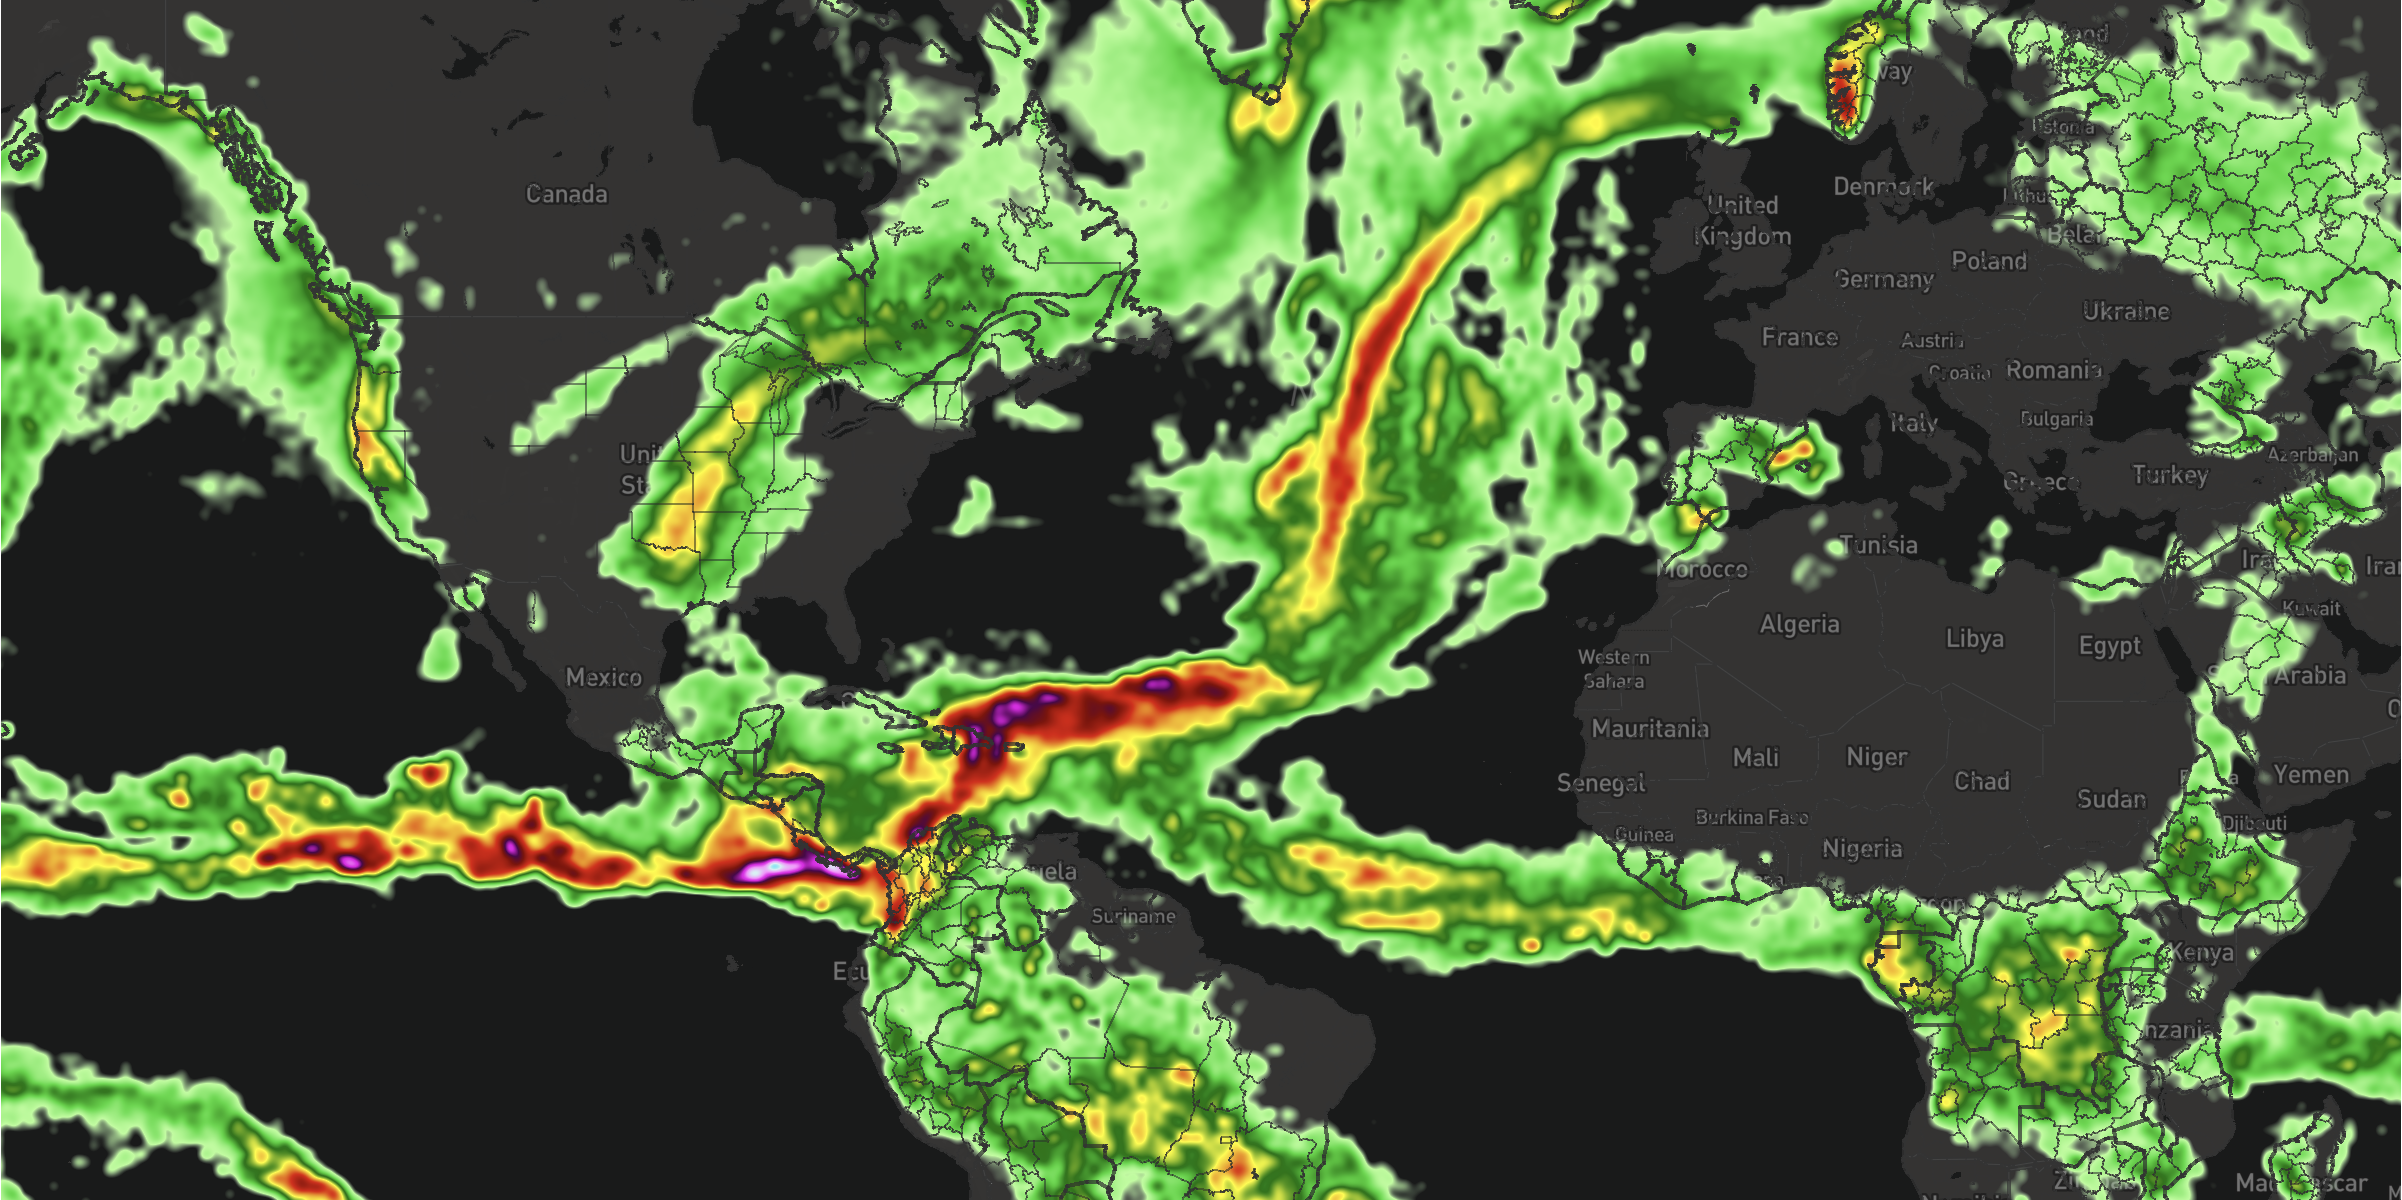
Encoded raster data has many benefits over traditional raster data, such as fully customizable real-time styling and advanced animations like particles and contours. Another benefit when it comes to time series data is the ability to perform mathematical operations on the data itself, creating entirely new data sets that can be used to tell a different story without the need to process the data on the server first.
MapsGL allows you to perform perform mathematical operations on encoded time series raster data in real-time, such as summing, differencing, averaging, finding the minimum, or finding the maximum of the data. Not only can you perform these operations across the entire time series, but you can also control the time range over which the operations are performed, allowing you to focus on specific time periods such as an hour, day, or week.
Configuration
Data operations are defined using the TimeSeriesOperation type, which is an object with the following properties:
type TimeSeriesOperation = {
    type: 'none' | 'sum' | 'max' | 'min';
    period?: 'none' | 'hour' | 'day' | 'week' | 'month' | 'year';
    aggregate?: boolean;
};| Option | Type | Default | Description |
|---|---|---|---|
type | string | none | Type of operation to perform on the data. |
period | string | none | Period of time to perform the operation on the data. |
aggregate | boolean | false | Whether to aggregate the data, meaning to combine the data from multiple intervals of the desired period into a single value. |
Operations can be configured with your custom encoded raster data sources or when adding built-in weather layers to your map.
Supported Operations
The following mathematical operations are supported by MapsGL:
sum: Adds, or accumulates, the data values together.avg: Averages the data values.min: Finds the minimum data value.max: Finds the maximum data value.
Sum
The sum operation adds the data values together across the time series or the specified period. This operation is useful for combining multiple data sources or for creating a new data set that represents the total value of the data over time, such as the total accumulated precipitation over multiple days or weeks.
operation: { type: 'sum' }The following example uses a sum operation to animate the total accumulated precipitation across the time range using the built-in precip weather layer:
controller.addWeatherLayer('precip', {
    timing: {
        operation: { type: 'sum' }
    }
});Average
The avg operation averages the data values across the time series or the specified period. This operation is useful for creating a new data set that represents the average value of the data over time, such as the average temperature over a day or week.
One thing to note with the avg operation is that it does not animate across the time series like the sum, min, and max operations. Instead, it will display the single average value for the entire time series or the specified period.
operation: { type: 'avg' }The following example uses an avg operation to display the single average temperature across the time range using the built-in temperatures weather layer:
controller.addWeatherLayer('temperatures', {
    timing: {
        operation: { type: 'avg' }
    }
});
Minimum
The min operation finds the minimum data value across the time series or the specified period. This operation is useful for creating a new data set that represents the minimum value of the data over time, such as the minimum temperature over a day or week.
operation: { type: 'min' }The following example uses a min operation to display the minimum temperature across the time range using the built-in temperatures weather layer:
controller.addWeatherLayer('temperatures', {
    timing: {
        operation: { type: 'min' }
    }
});Maximum
The max operation finds the maximum data value across the time series or the specified period. This operation is useful for creating a new data set that represents the maximum value of the data over time, such as the maximum wind speed over a day or week.
operation: { type: 'max' }The following example uses a max operation to display the maximum wind speed across the time range using the built-in wind-speeds weather layer:
controller.addWeatherLayer('wind-speeds', {
    timing: {
        operation: { type: 'max' }
    }
});Operations By Period
By default, operations are performed across the entire time series of the data. However, you can also specify a period of time to perform the operation on, such as an hour, day, week, month, or year. This allows you to focus on specific time periods and create new data sets that represent values for a variety of time ranges.
Supported periods
The following time periods are supported by MapsGL for performing operations:
hour: The operation is performed on each hour in the time series.day: The operation is performed on each day in the time series.week: The operation is performed on each week in the time series.month: The operation is performed on each month in the time series.year: The operation is performed on each year in the time series.
For example, the following example uses a sum operation to animate the total accumulated precipitation for each day in the time series using the built-in precip weather layer:
controller.addWeatherLayer('precip', {
    timing: {
        operation: { type: 'sum', period: 'day' }
    }
});
Here you can see how the total accumulated precipitation totals reset at the beginning of each day in the time series:
Or, you can use a max operation on the temperatures weather layer to display the maximum temperature for each day in the time series:
controller.addWeatherLayer('temperatures', {
    timing: {
        operation: { type: 'max', period: 'day' }
    }
});Aggregating Data
By default, operations are performed on each interval of the time series which allows you to animate the change in value over time as a result of the operation. However, you can also choose to aggregate the data which will combine the data from multiple intervals of the desired period into a single value. As a result, the data will not animate across the time series but will instead display the single aggregated value for the entire time series or the specified period.
To aggregate the data, set the aggregate property to true in the operation configuration:
operation: { type: 'sum', aggregate: true }The following example uses a sum operation with aggregation to display the total accumulated precipitation for the entire time series using the built-in precip weather layer:
controller.addWeatherLayer('precip', {
    timing: {
        operation: { type: 'sum', aggregate: true }
    }
});
If you then animated this layer, you would not see any change in the data value over time as the data is aggregated into a single value:

Aggregating the same precipitation data by day would show the total accumulated precipitation as distinct intervals for each day in the time series:
controller.addWeatherLayer('precip', {
    timing: {
        operation: { type: 'sum', period: 'day', aggregate: true }
    }
});If you don't want to interpolate the transition between the aggregated intervals, you can set the sample.meld property to false in the layer's paint style configuration:
controller.addWeatherLayer('precip', {
    timing: {
        operation: { type: 'sum', period: 'day', aggregate: true }
    },
    paint: {
        sample: {
            meld: false
        }
    }
});