A new way to manage your renewable financial risks by analysis and hedging.
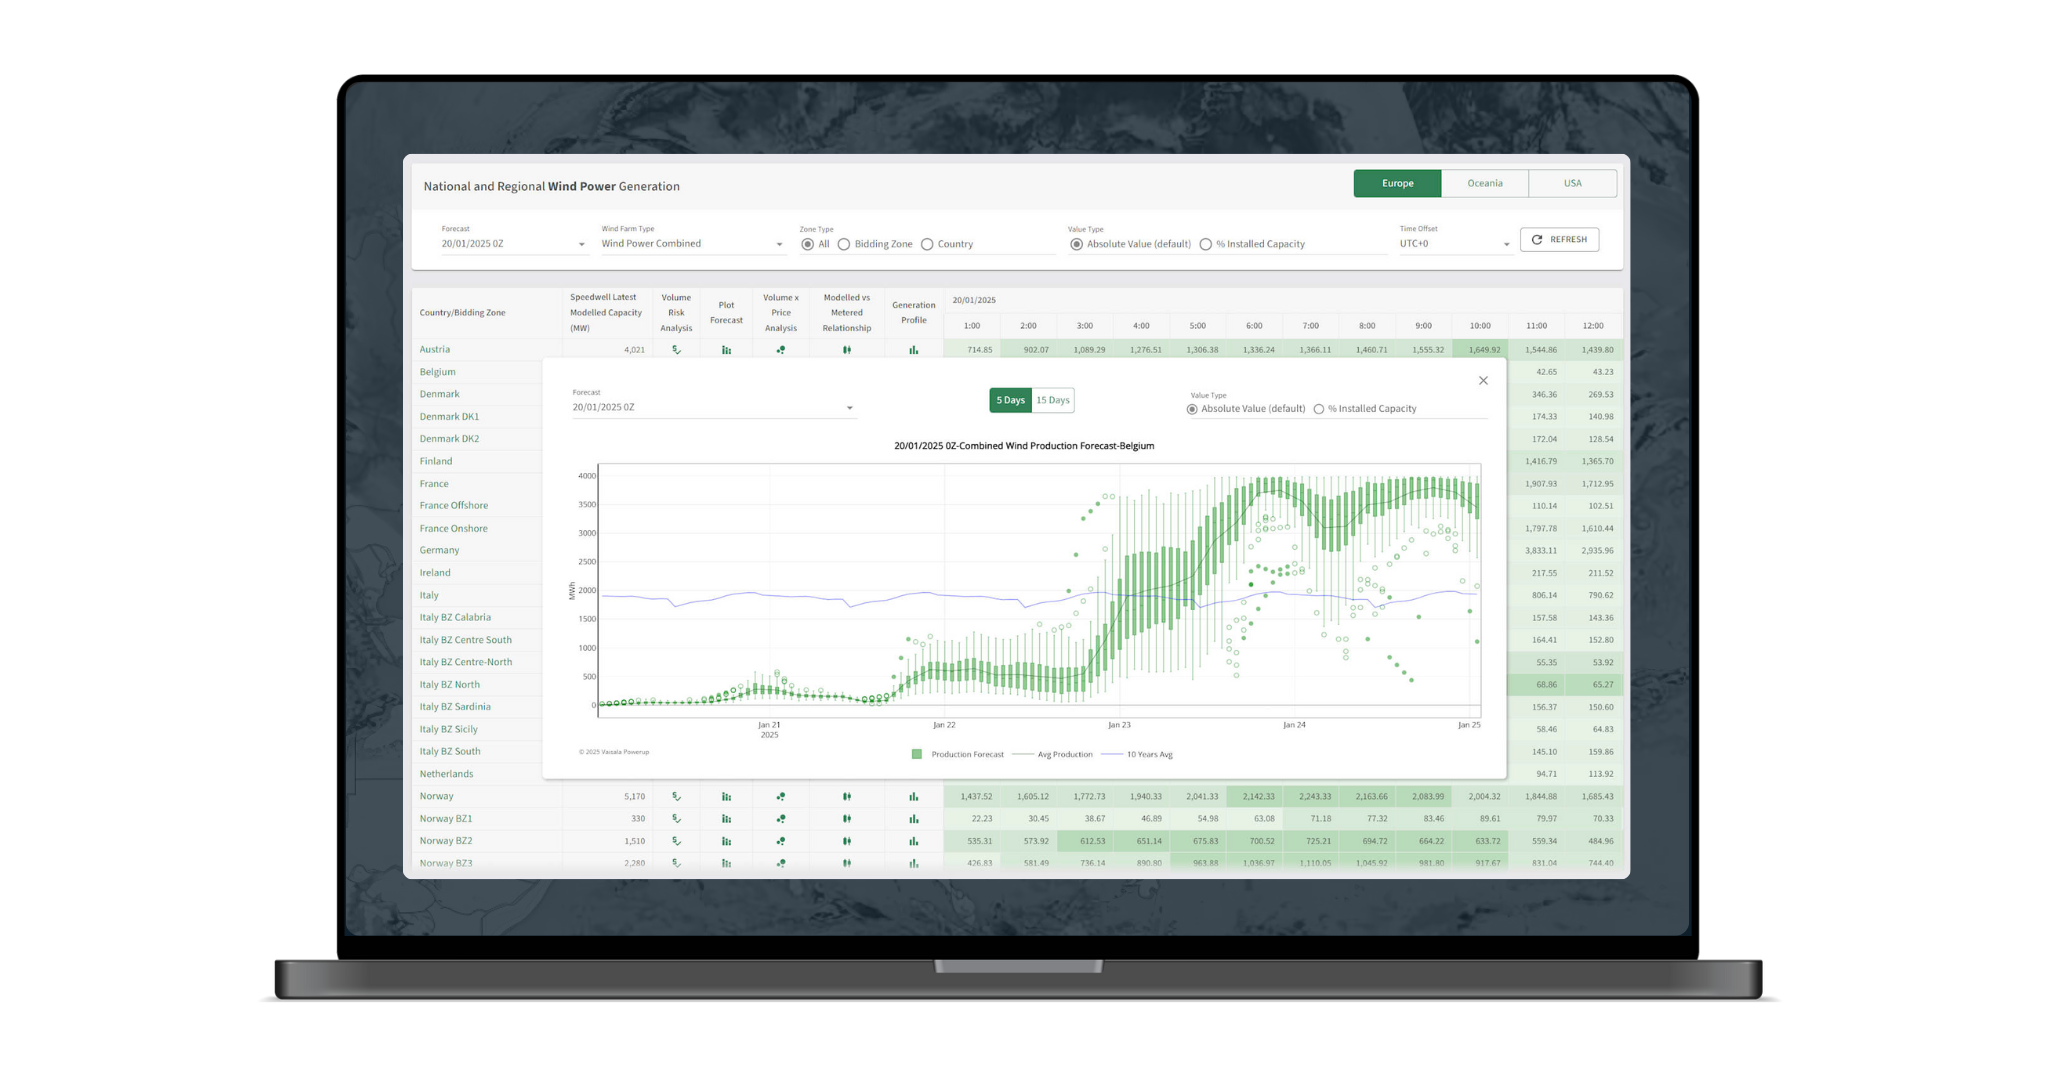
With Xweather Powerup, you can manage your financial outcomes for renewable energy. By understanding the production from individual farms to country and region levels, you can analyze and address the risk by structuring hedges to address the volume, shape, and price cannibalization risks. You can use existing indices in the market to manage your portfolio, and together, we can create your own index to maximize your benefit.

Why use wind and solar power generation hedging?
Wind and solar power have emerged as cornerstones of sustainable electricity generation as the world transitions to renewable energy. However, the variable nature of wind and solar and the increasing concentration of renewable energy pose significant financial challenges for producers and consumers, making effective hedging strategies essential.
Volume risk
Wind and solar generation's natural variability creates operational and financial risks for producers and grid operators, leading to revenue uncertainty. Powerup helps mitigate this risk with the tools to analyze volume risks and structure effective hedges.
Shape risk
Wind and solar generation often misalign with peak demand, reducing the market value of produced energy. Manage shape risk with Powerup tools to analyze generation patterns and hedge financial exposure.
Price cannibalization risk
As wind and solar penetration increase, oversupply during peak generation can drive prices down, reducing revenue. With Powerup, you have the tools to protect against these price drops, ensuring predictable income even in cannibalized markets.

Watch Vaisala Xweather, New Re, Statkraft & BGC in conversation


Who benefits?
Renewable energy producers
Monitor performance metrics of renewable assets
Access detailed forecasts
Hedge risks related to fluctuating production levels and energy prices
Leverage a customized index unique for each renewable energy producer
Conventional power generators
Renewable production's influence on power prices and supply fluctuations
Tools to analyze the interaction between renewable energy sources
Support for decision-making processes in areas like plant dispatch and maintenance scheduling
Investment funds trading power across multiple markets
Market performance dashboard
Regional and global market trends
See arbitrage opportunities
Renewable energy's effect on market prices and supply side
PPA Off-Takers
Monitor performance metrics
Access reliable forecasts
Hedge variability risks
Optimize portfolio with tailored indexes


Data sources & modelling
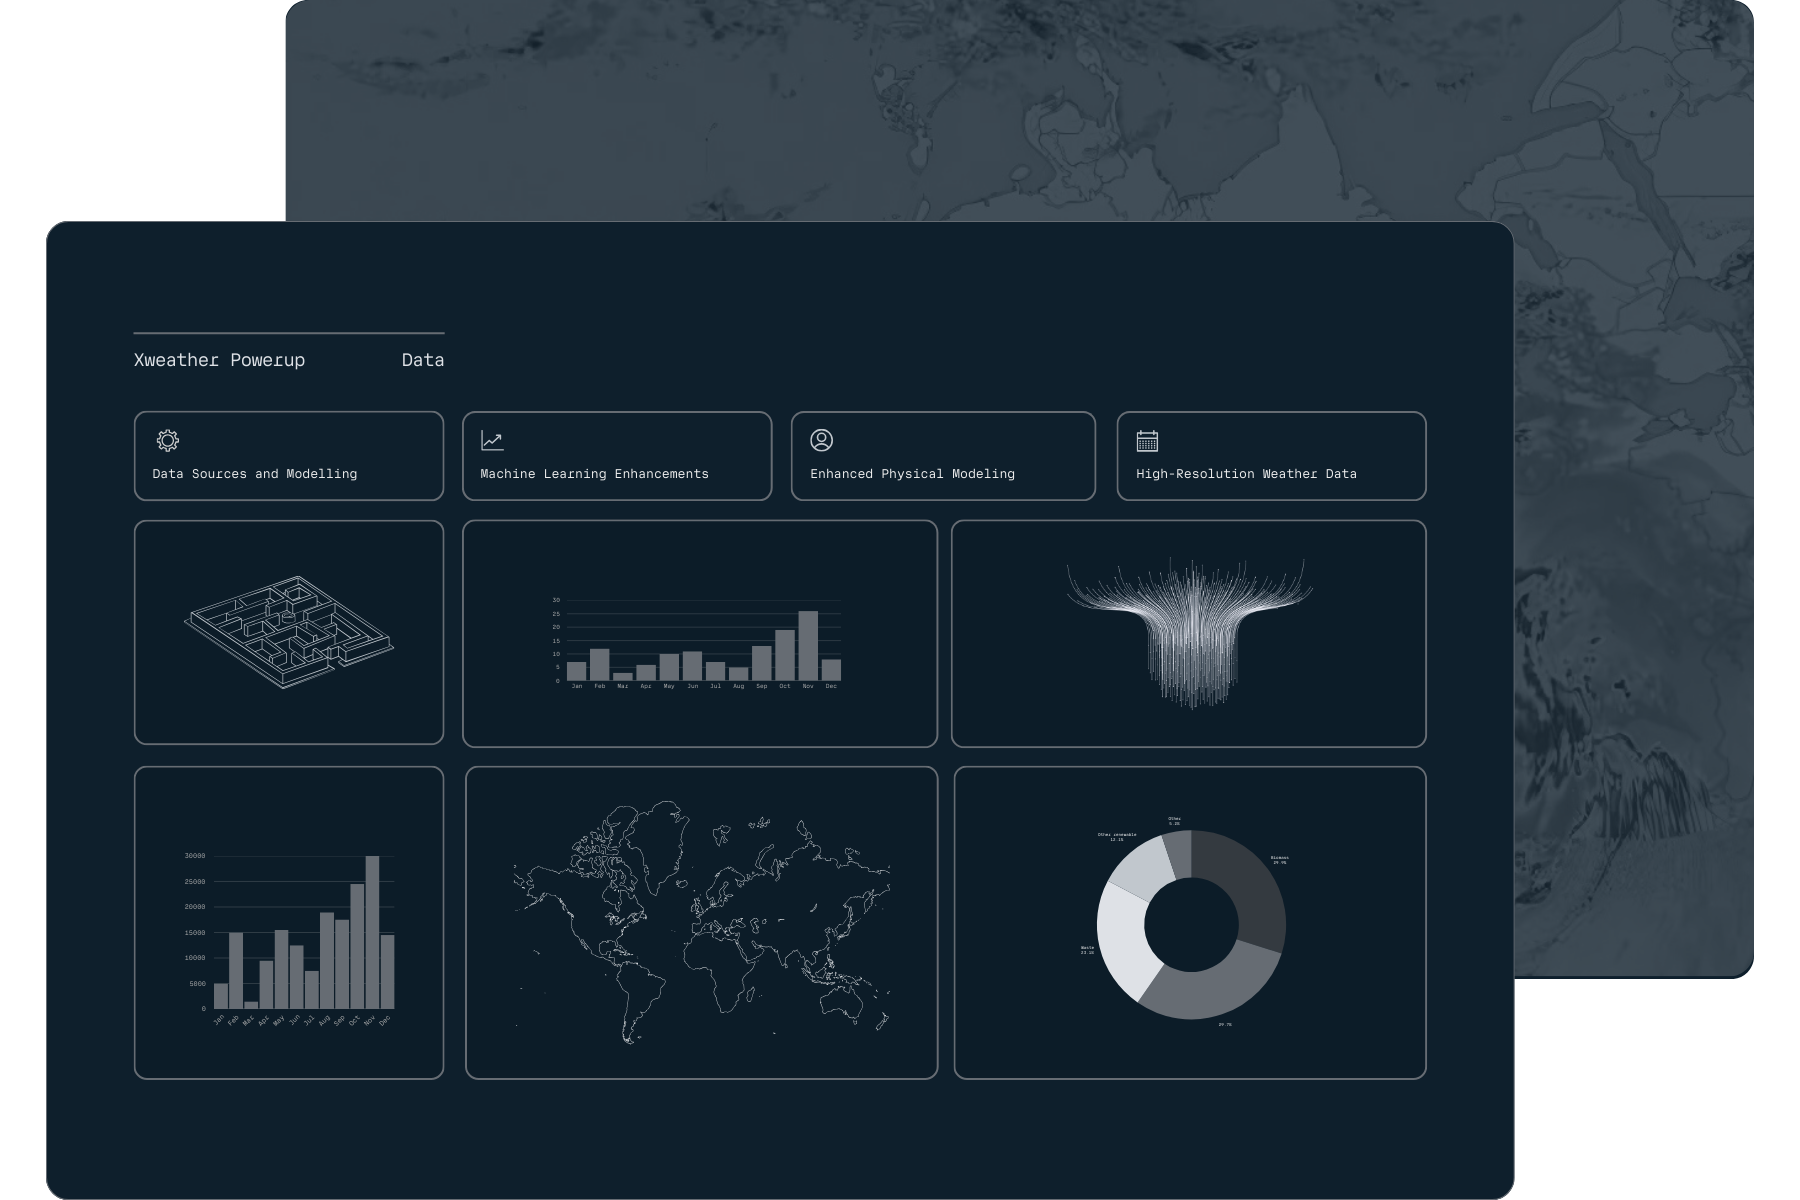
Powerup's core strength lies in advanced production modeling, which combines decades of expertise, cutting-edge technology, and reliable data. By integrating optimized physical models with 40+ years of historical weather data, Powerup equips you with accurate, actionable insights for renewable energy assets.
Customize your Xweather Powerup subscription
Build a plan tailored to your needs with Powerup features designed to provide you with actionable insights and data-driven solutions to meet your specific energy and weather-related requirements.
Pricing is based on the amount of modules, indices, and accesses.
Global and regional wind and solar power generation dashboards
Europe renewable power
Wind: Austria, Belgium, Denmark DK1, Denmark DK2, Finland, France, Germany, Italy (Total, Calabria, Centre-South, Centre-North, North, Sardinia, Sicily, South), Netherlands, Norway (Total, BZ1, BZ2, BZ3, BZ4), Poland, Portugal, Spain, Sweden (Total, BZ1, BZ2, BZ3, BZ4), United Kingdom
Solar: Belgium, France, Germany, Italy, Netherlands, Portugal, Spain, United Kingdom
USA renewable power
Wind: CAISO, ERCOT Total, ERCOT Coastal, ERCOT North, ERCOT Panhandle, ERCOT South, ERCOT West, MISO, NYISO, SPP
Solar: CAISO, ERCOT Total
APAC renewable power
Wind: Australia (NSW, SA, VIC), Japan
Solar: Japan (50Hz, 60Hz)
Coming Soon: Wind PJM
Farm and portfolio specific wind and solar power indices
The basic modeling service includes advanced interpolation techniques, hub height adjustments, and wind turbine-specific power curves to deliver theoretical wind farm power generation models. This method ensures the data is tailored to each site's unique characteristics, providing an initial estimate of the site's power production variability.
The advanced modeling service adds a layer of customization for both single farms and portfolios of farms. Our team of data scientists and renewable energy experts meticulously prepares and reviews each wind farm model, applying advanced statistical adjustments to ensure the highest level of accuracy and reliability.
Wind power modeling
Full history since 1st of Jan 1979
Ongoing updates
Hourly probabilistic forecast
Access to all tools
Wind speed, solar radiation data, and real-time weather maps
Gridded data API for wind and solar radiation variables
With Powerup, you can access our gridded data API for wind (100m) and solar radiation variables. The subscription ranges from 1 million values up to 10 million.
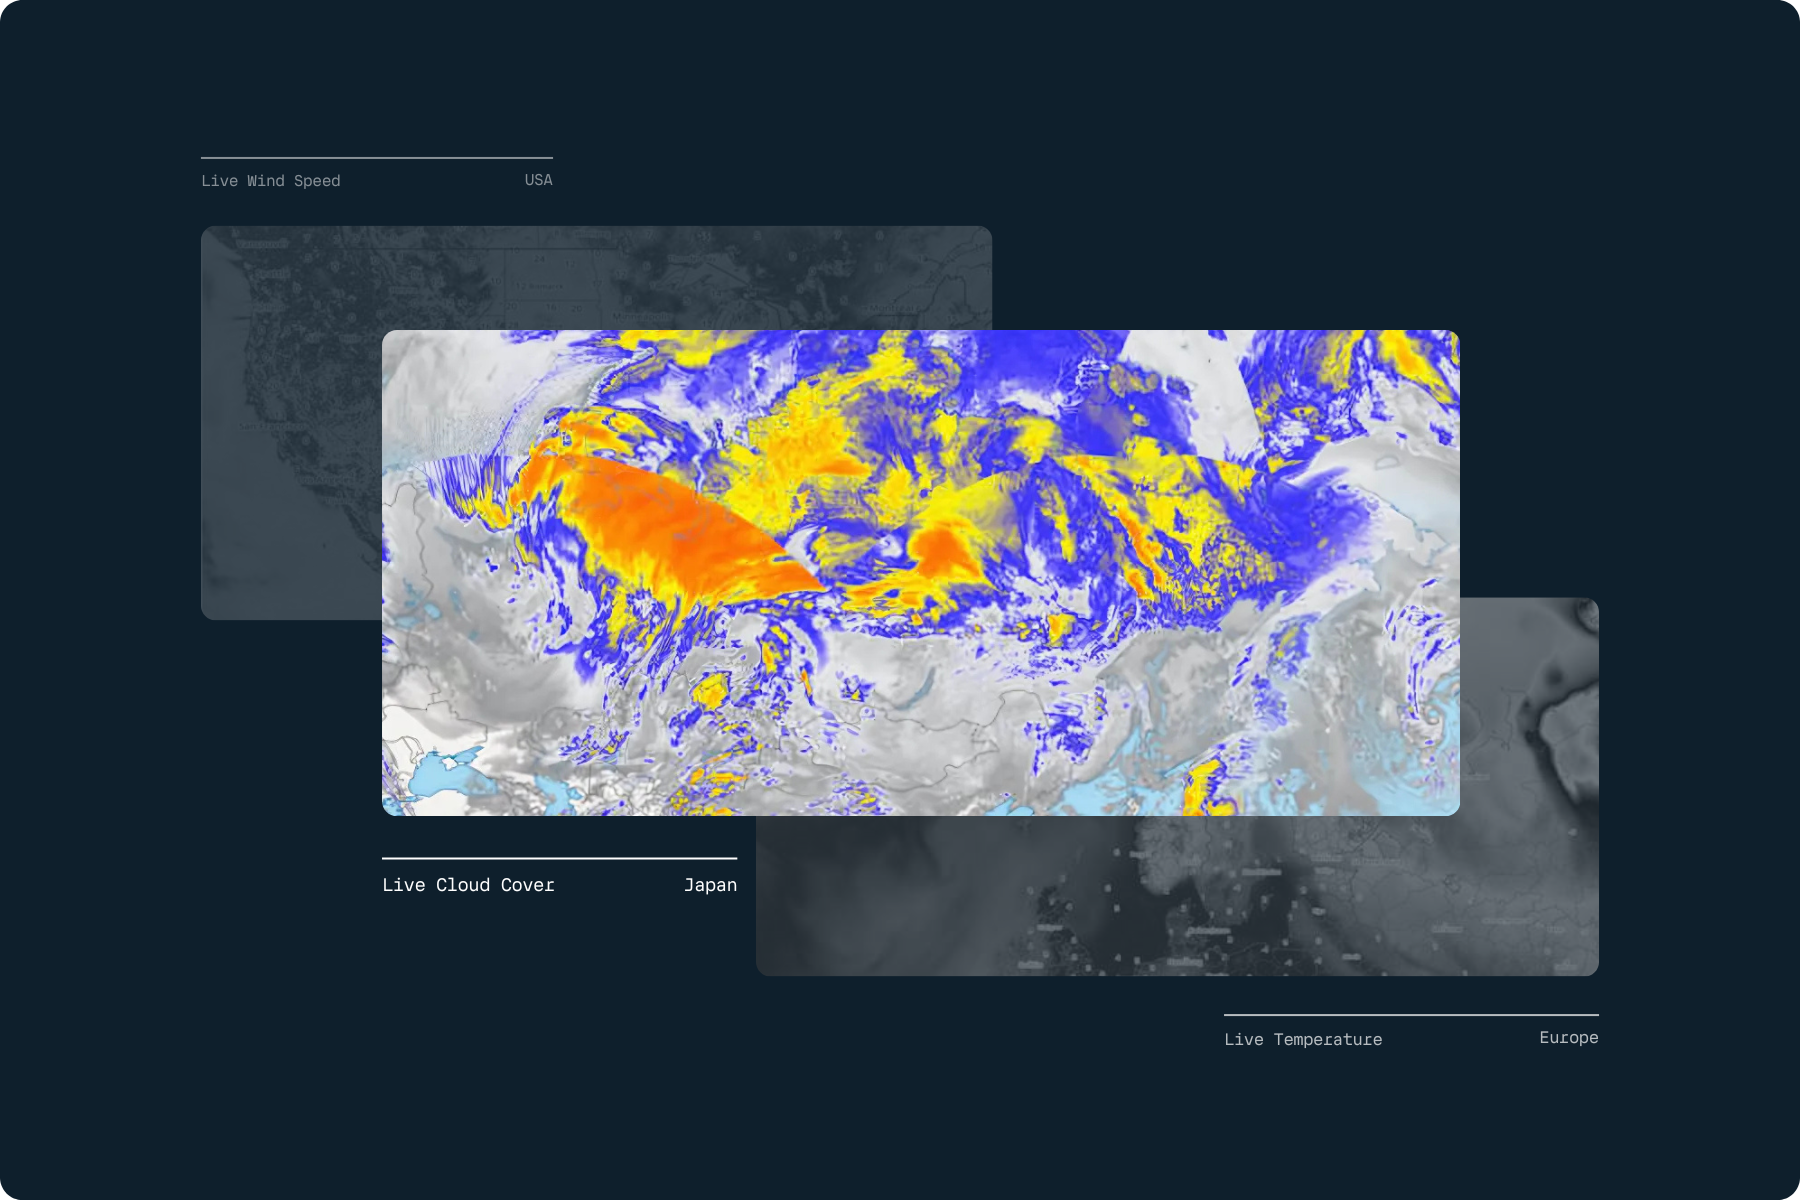
Real-time weather maps
Stay ahead with our real-time weather maps, providing up-to-the-minute wind, temperature, and rainfall data. Designed for precision and ease of use, this tool offers invaluable insights to support your decision-making in energy forecasting, operations, and planning.
Get started
Book a demo to see all Powerup features.
Pricing is based on the amount of indices. One index includes historical data, forecasts, and access to tools.
