Xweather Powerup: Features
Xweather Powerup for renewable asset operators and energy traders.
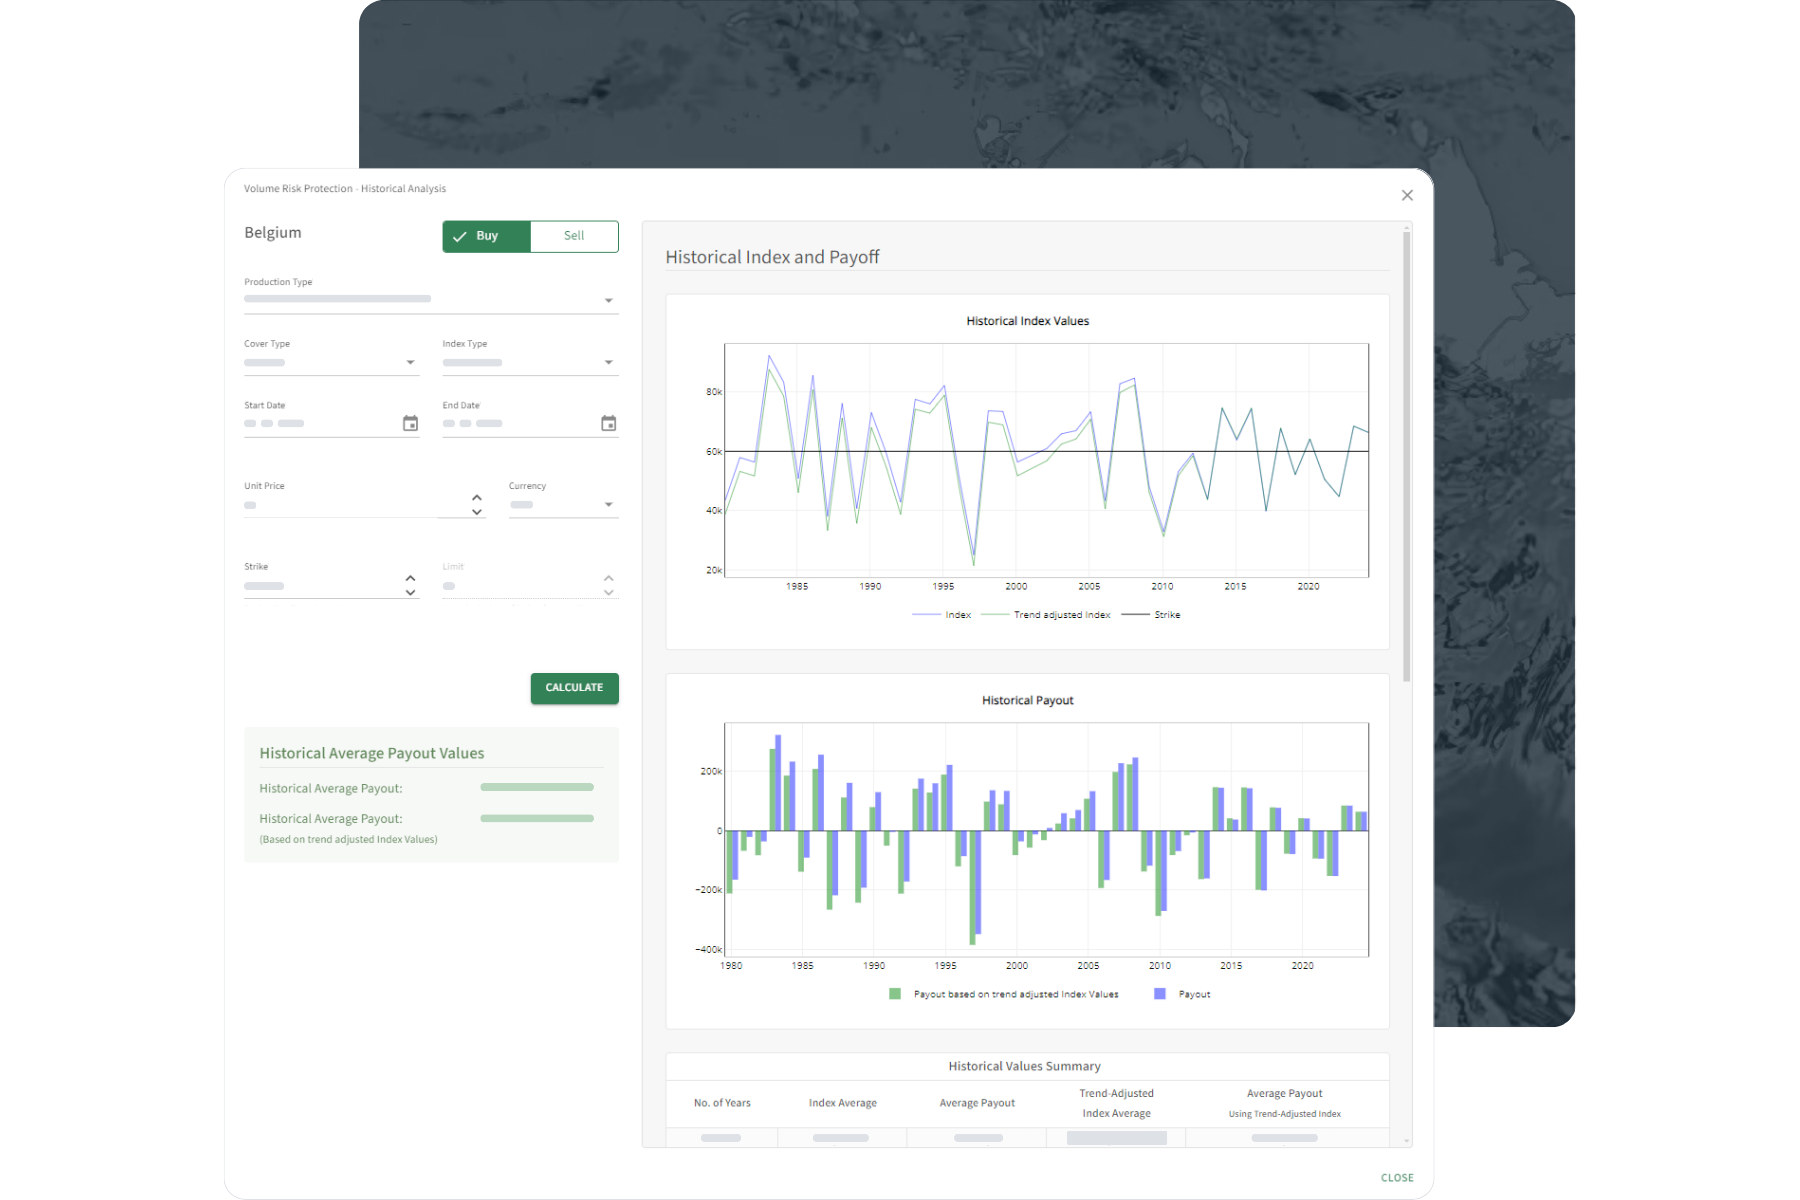
Volume risk hedge design tool
Powerup provides the tools to tailor a customized weather derivative contract for your specific needs, enabling you to hedge against low wind speed and solar irradiance over different time frames to safeguard financial stability, even in adverse weather conditions. Our platform allows you to select the weather index that best fits your risk profile while providing full flexibility to define the critical contract parameters such as the risk period, tick size, contract type (e.g., option or swap), strike price, and contract limit.
Once your contract is configured, you can review the historical index values, see payoff calculations, and analyze percentile curves to understand potential outcomes better and refine your risk management strategies. With Powerup’s comprehensive suite of tools, you can confidently navigate and mitigate the financial impact of weather-related volatility.

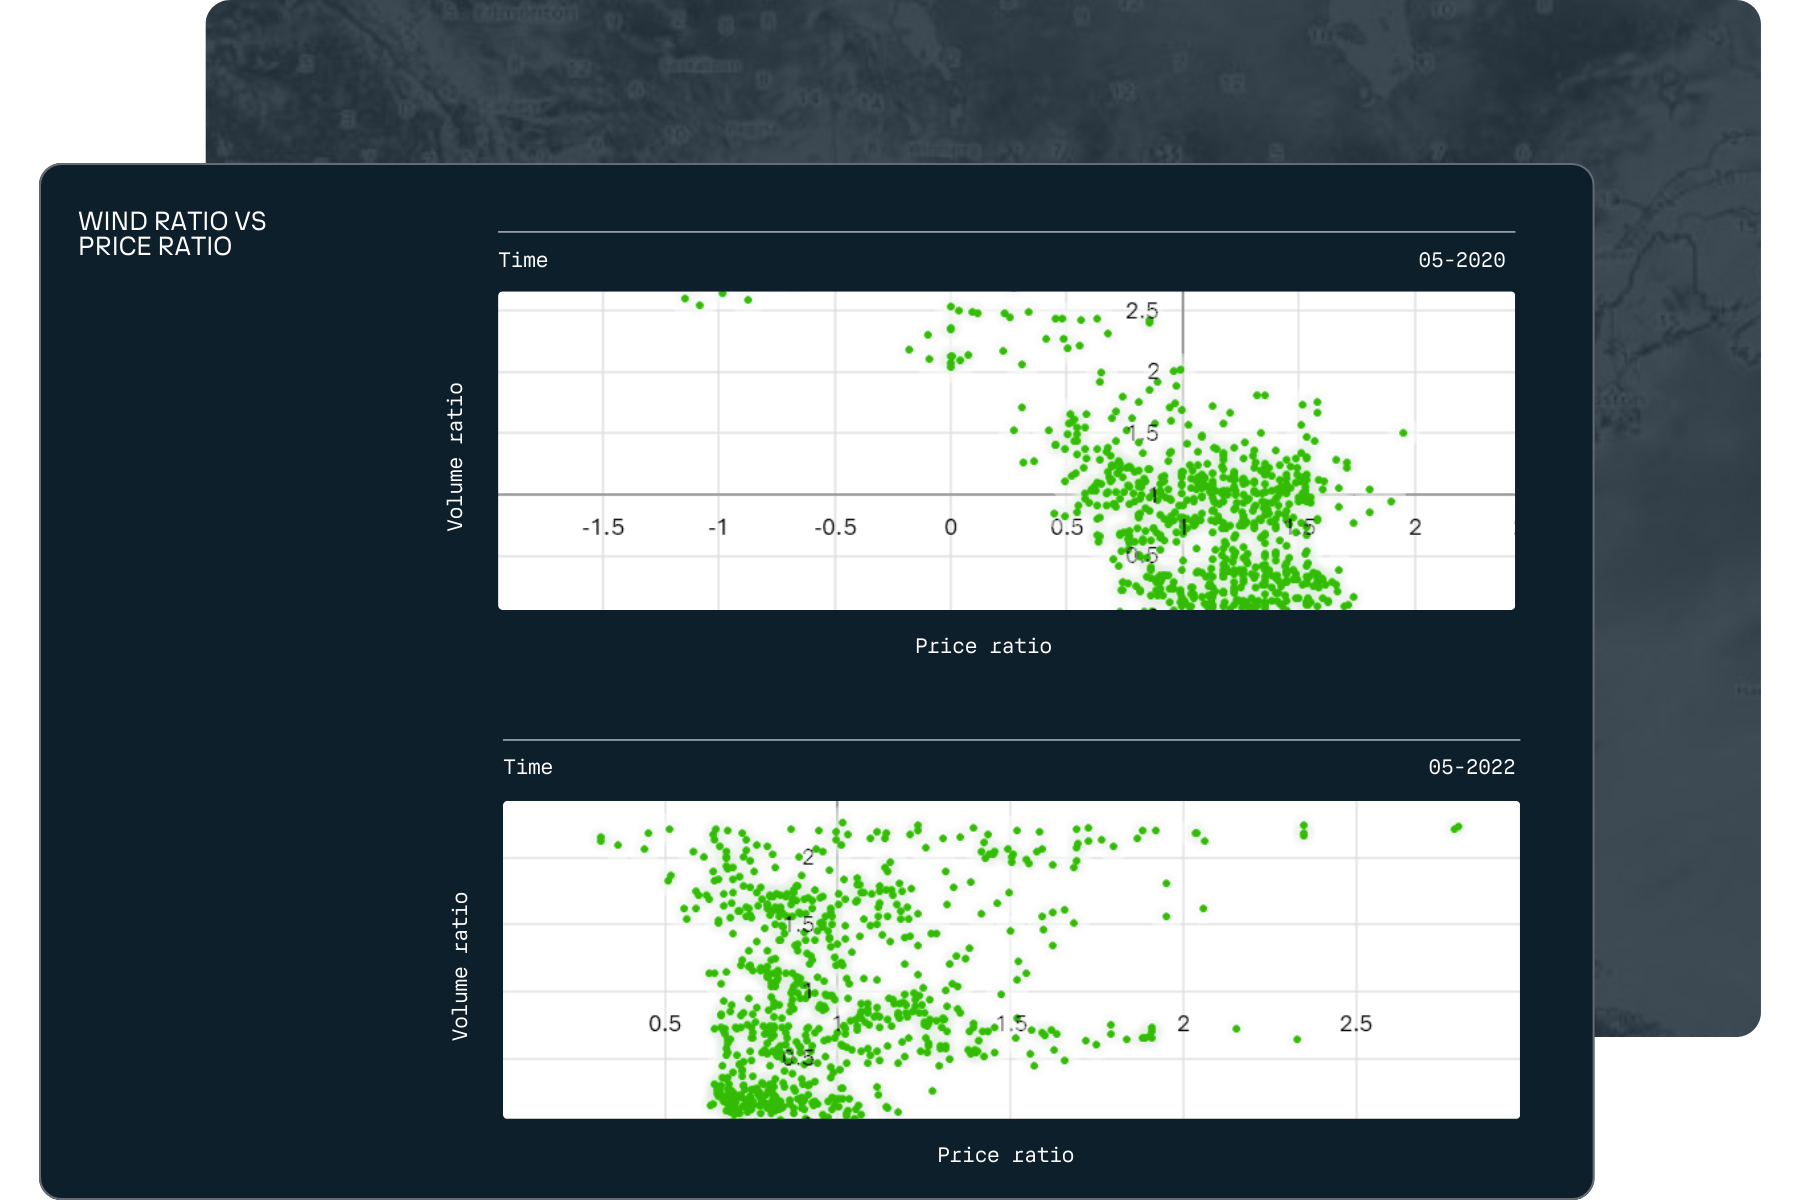

Shape and cannibalization risk analysis
Wind generation is inherently variable, often misaligning with peak market demand, leading to missed financial opportunities. Energy produced during low-demand periods fetches lower prices, creating shape risk, while increased renewable penetration can drive prices down, eroding revenue through price cannibalization.
Powerup indices let you compare your production against national and regional generation benchmarks at fixed capacity, helping you identify timing discrepancies and anticipate financial risks. Designed for risk transfer, Powerup allows you to hedge shape risk and price volatility, ensuring greater financial stability. With deeper insights, you can optimize operations and contracts to maximize value in favorable market conditions.
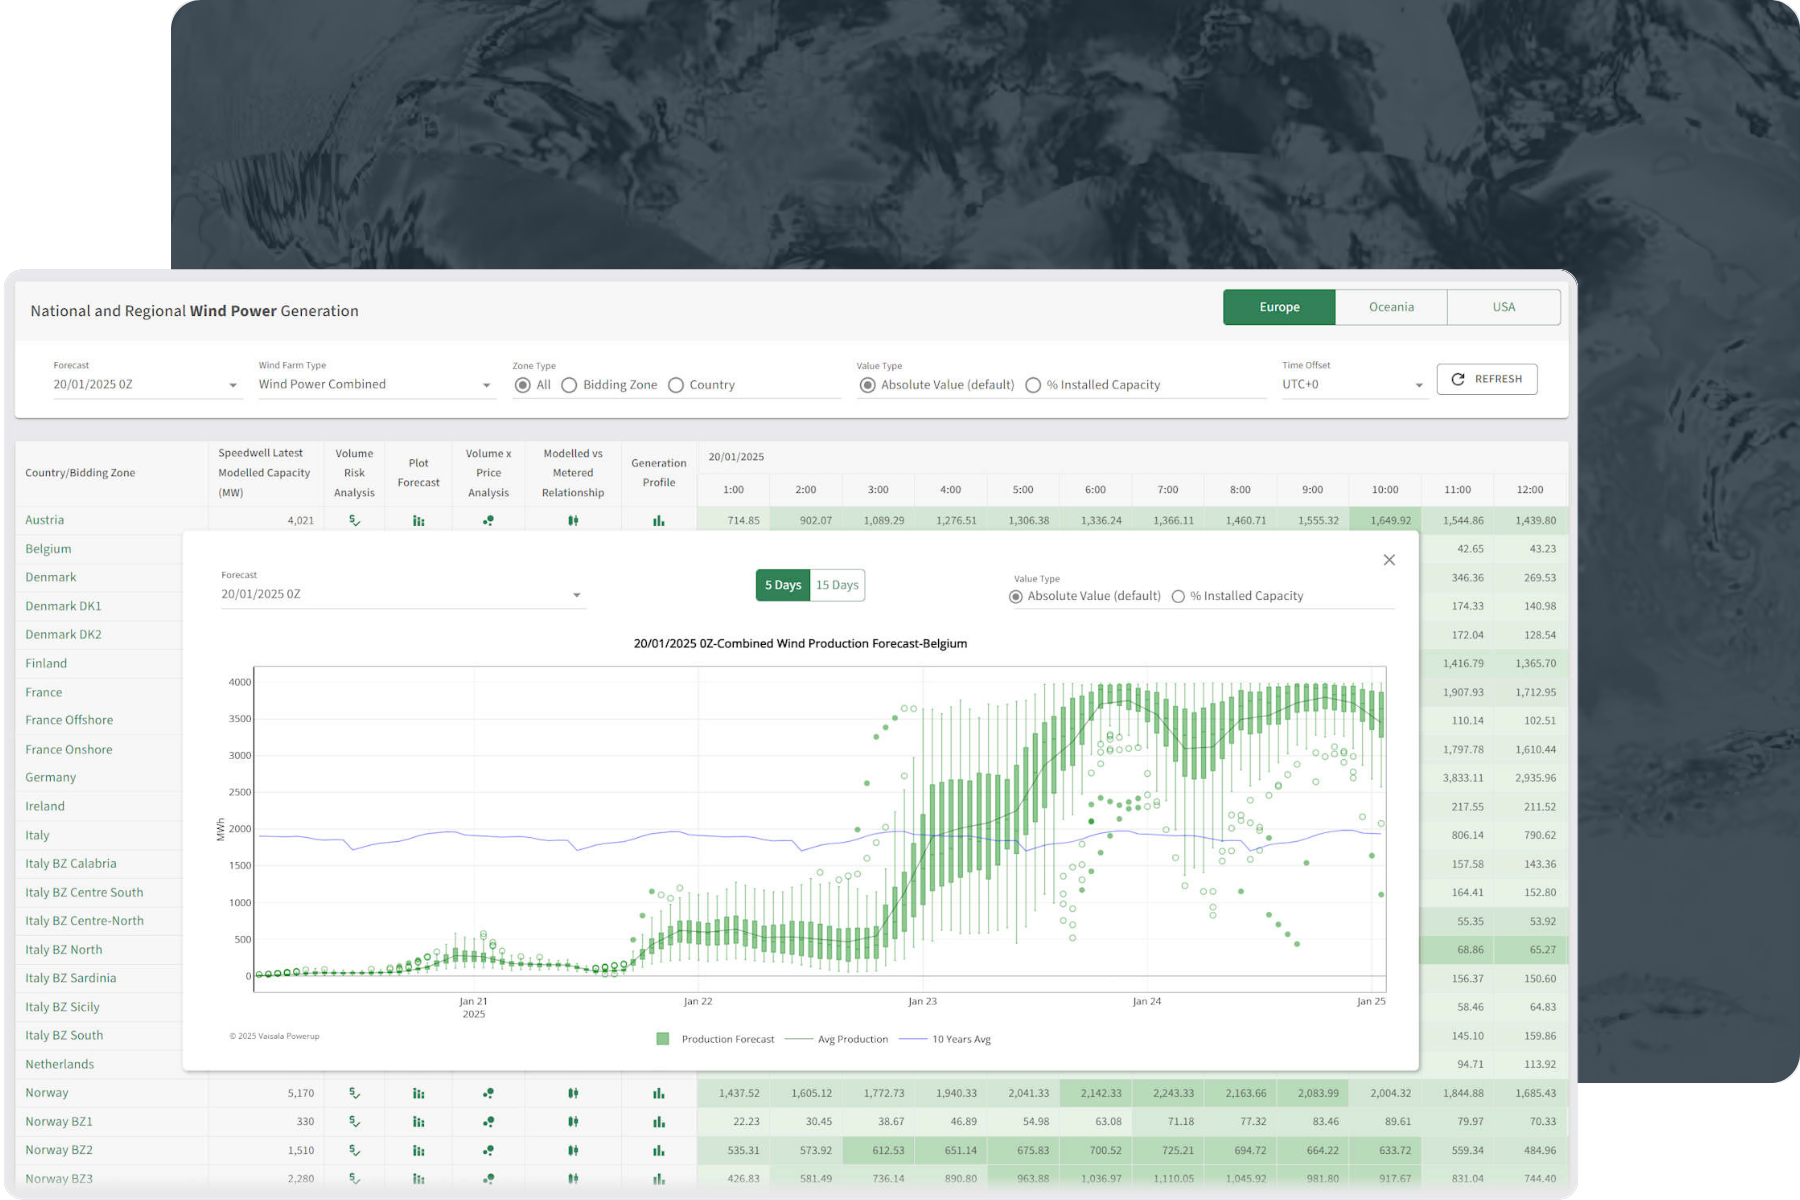
Renewable energy production dashboard
Powerup gives you precise, multi-scale insights into renewable energy production, from national grids to individual wind farms and solar arrays. Whether tracking overall grid contributions or optimizing specific assets, the platform provides the data to manage renewable energy risks effectively.
At the core of Powerup is a user-friendly dashboard that simplifies complex data into clear, actionable insights. Monitor real-time production metrics, compare modeled outputs against forecasts, and customize views to focus on what matters most. With access to Speedwell Wind and Solar Power Generation indices, you can hedge against weather variability, grid fluctuations, and price changes—ensuring smarter decisions, optimized asset performance, and stronger risk management.

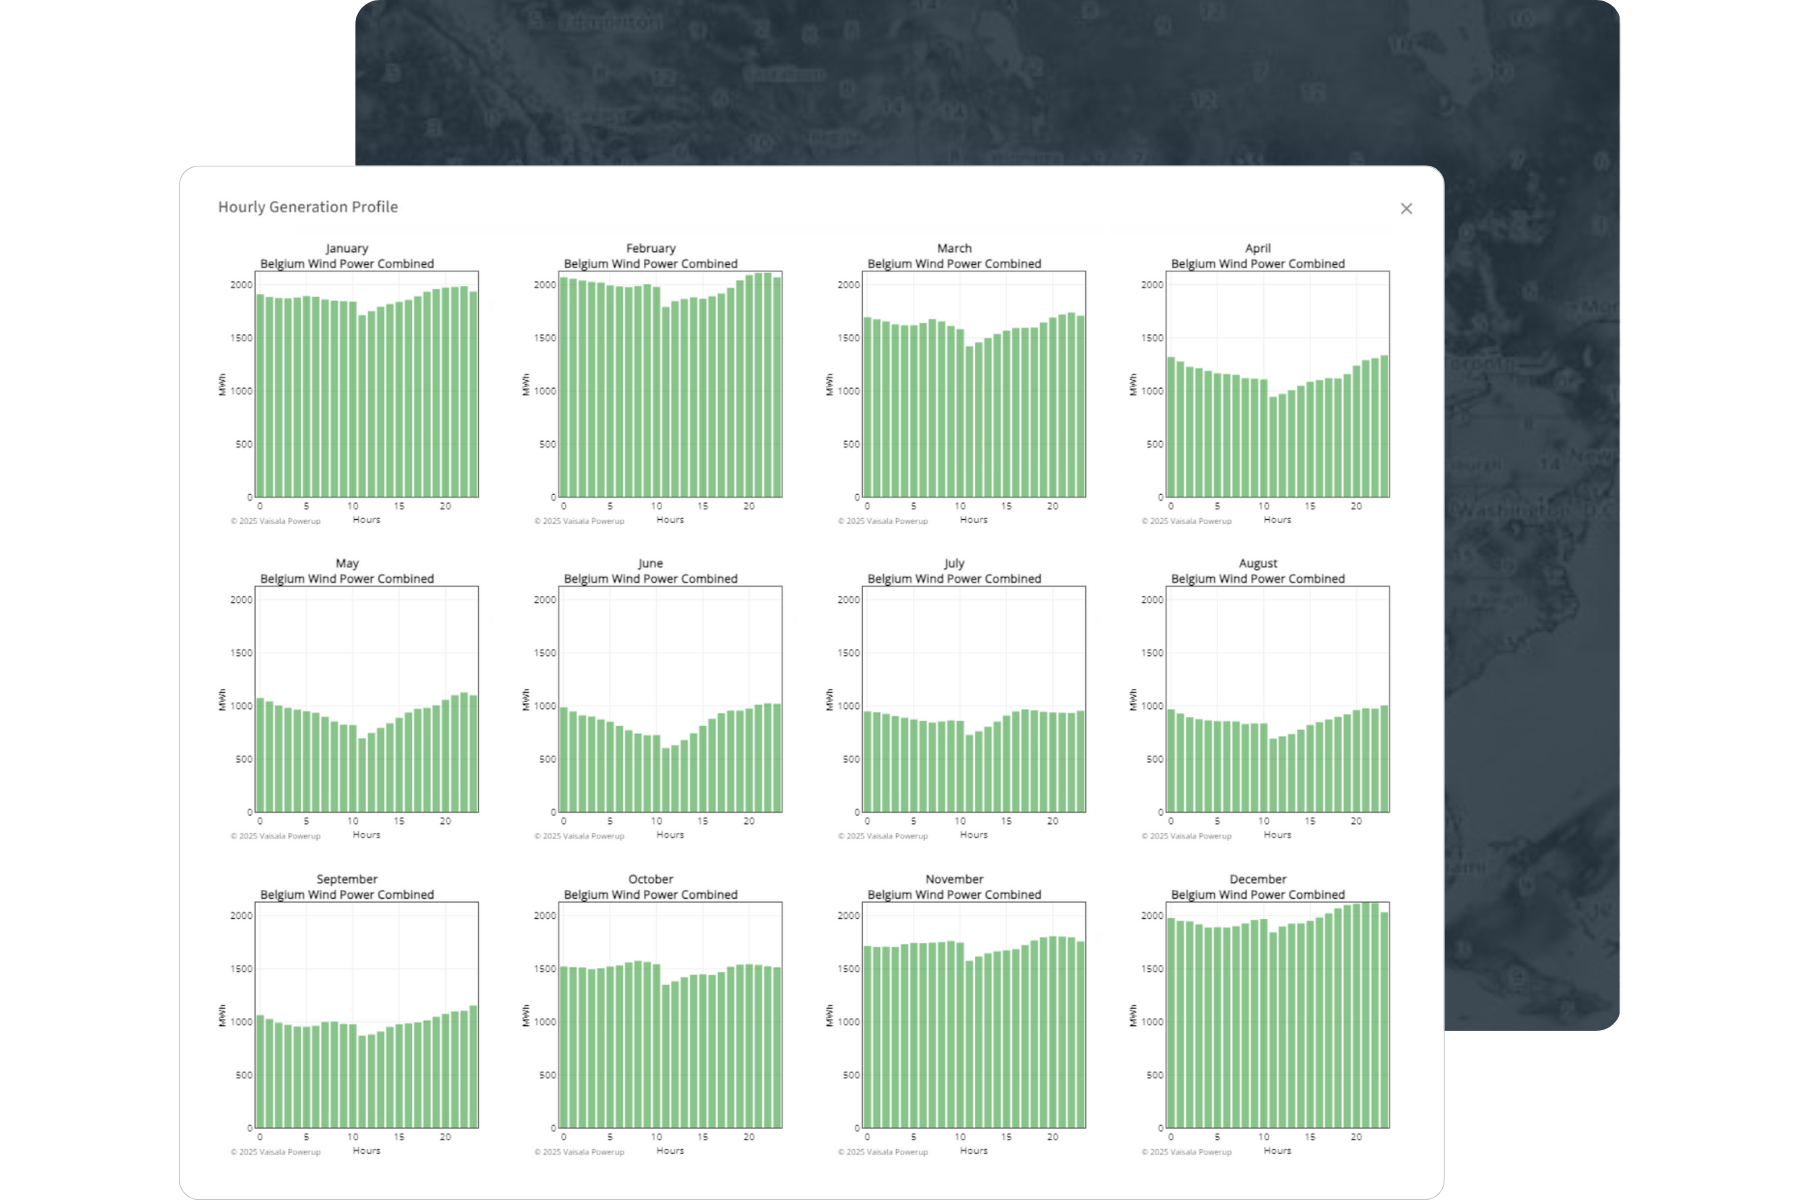

Hourly generation profile
This matrix offers a comprehensive and detailed breakdown of energy generation patterns, showing hourly generation data for each month. Easily visualize and analyze energy production fluctuation throughout the day and across different seasons.
Identify peak and off-peak periods: Pinpoint the highest and lowest energy generation hours to optimize grid management and resource allocation.
Track seasonal variations: Observe how generation patterns shift from month to month, helping you anticipate energy supply and demand changes.
Support decision-making: Use the data to inform strategies for energy storage, distribution, and renewable energy integration.
Enhance forecasting accuracy: Take advantage of detailed hourly profiles to improve the precision of your energy forecasts and planning models.
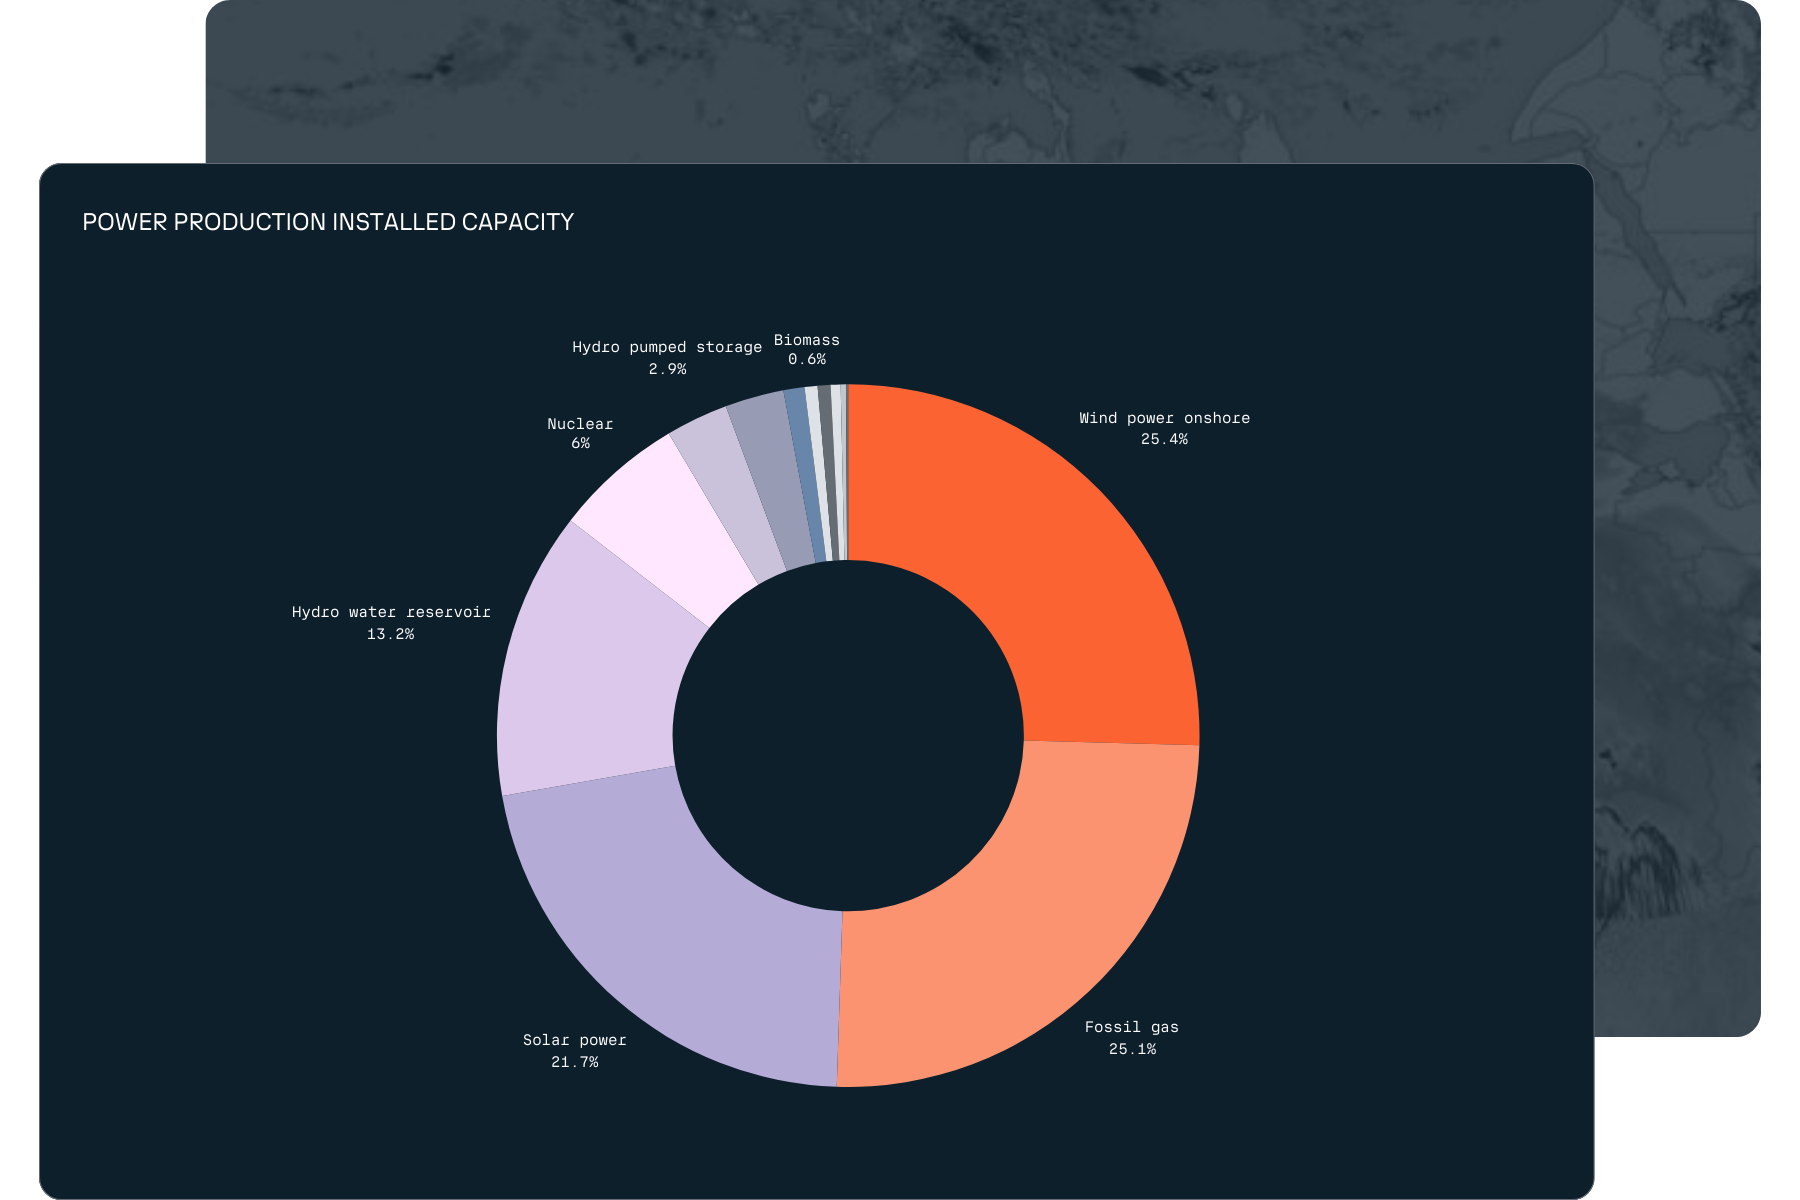
National power stack information
Powerup goes beyond raw data, offering a comprehensive view of the power stack across multiple generation areas. Understand how much energy is produced and the sources, technologies, and dynamics behind it.
Analyze energy mix: Break down generation by type, from renewables to fossil fuels.
Evaluate grid stability: Assess reliability and variability across sources.
Support renewable integration: Identify ways to optimize clean energy adoption.
Compare regional variations: Explore differences in power stacks for better planning.

Data outputs
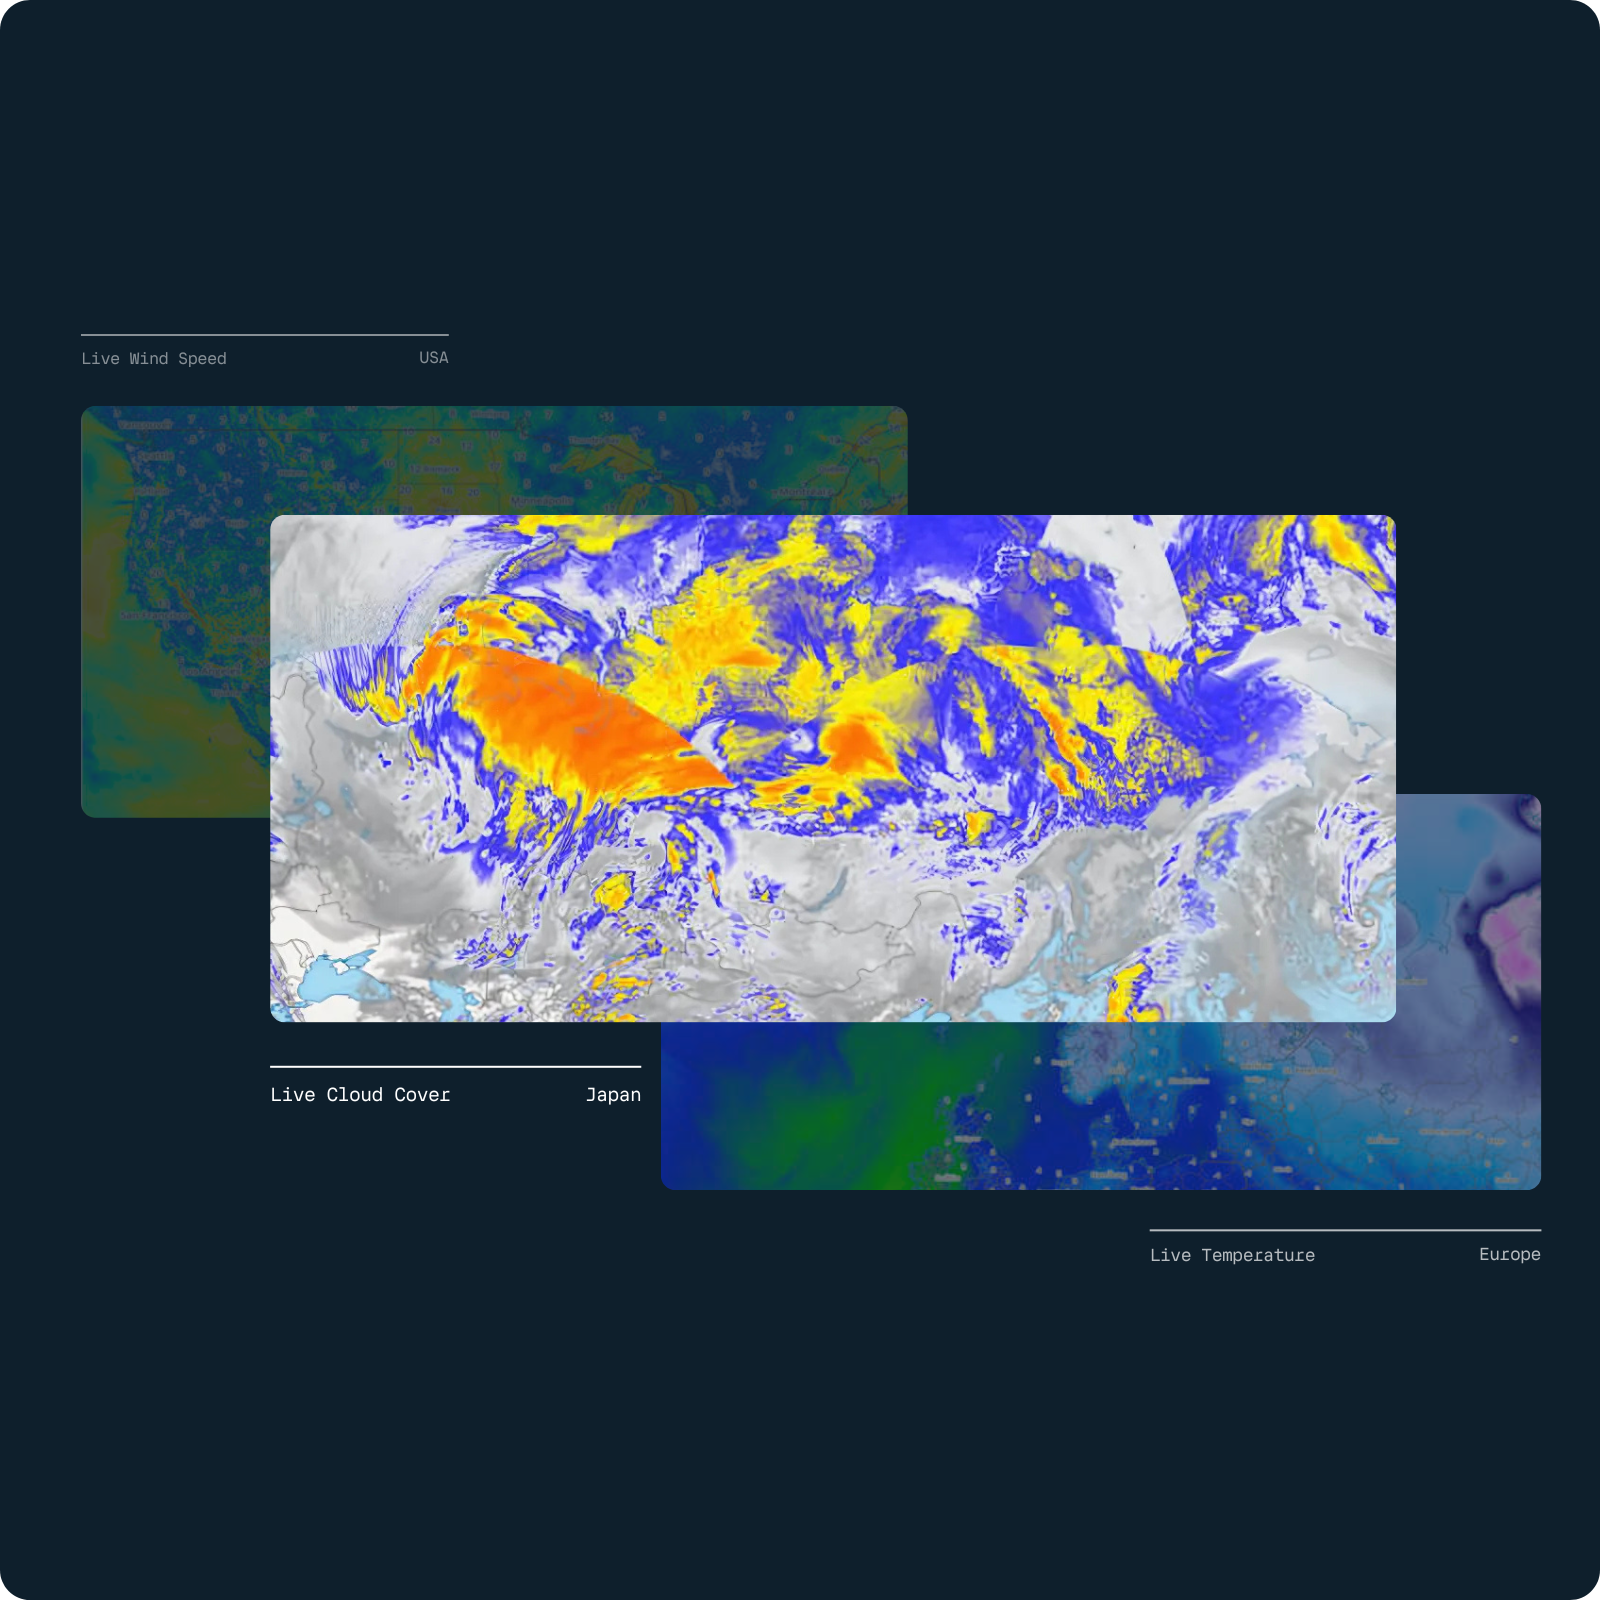
Unlock precision with gridded data & maps
Gridded data
Empower your projects with high-quality, interpolated gridded data tailored to your needs. Our service provides seamless access to essential environmental variables, including:
Solar radiation: Optimize solar energy projects with accurate solar radiation data.
Temperature: Gain reliable temperature insights for climate studies, agriculture, and more.
Total precipitation: Plan and manage water resources with precise precipitation data.
Wind speed: Enhance wind energy planning and risk assessments with detailed wind speed information.
Maps
Powerup’s interactive weather maps give you a clear, real-time view of key weather conditions—temperature, wind speed, solar radiation, and cloud cover—that impact renewable energy production. These dynamic visualizations help you monitor, analyze, and understand the environmental factors affecting your energy assets, ensuring smarter decision-making and optimized performance.

Get started
Book a demo to see all Powerup features.
Pricing is based on the amount of indices. One index includes historical data, forecasts, and access to tools.