
Explore the report
Part 01
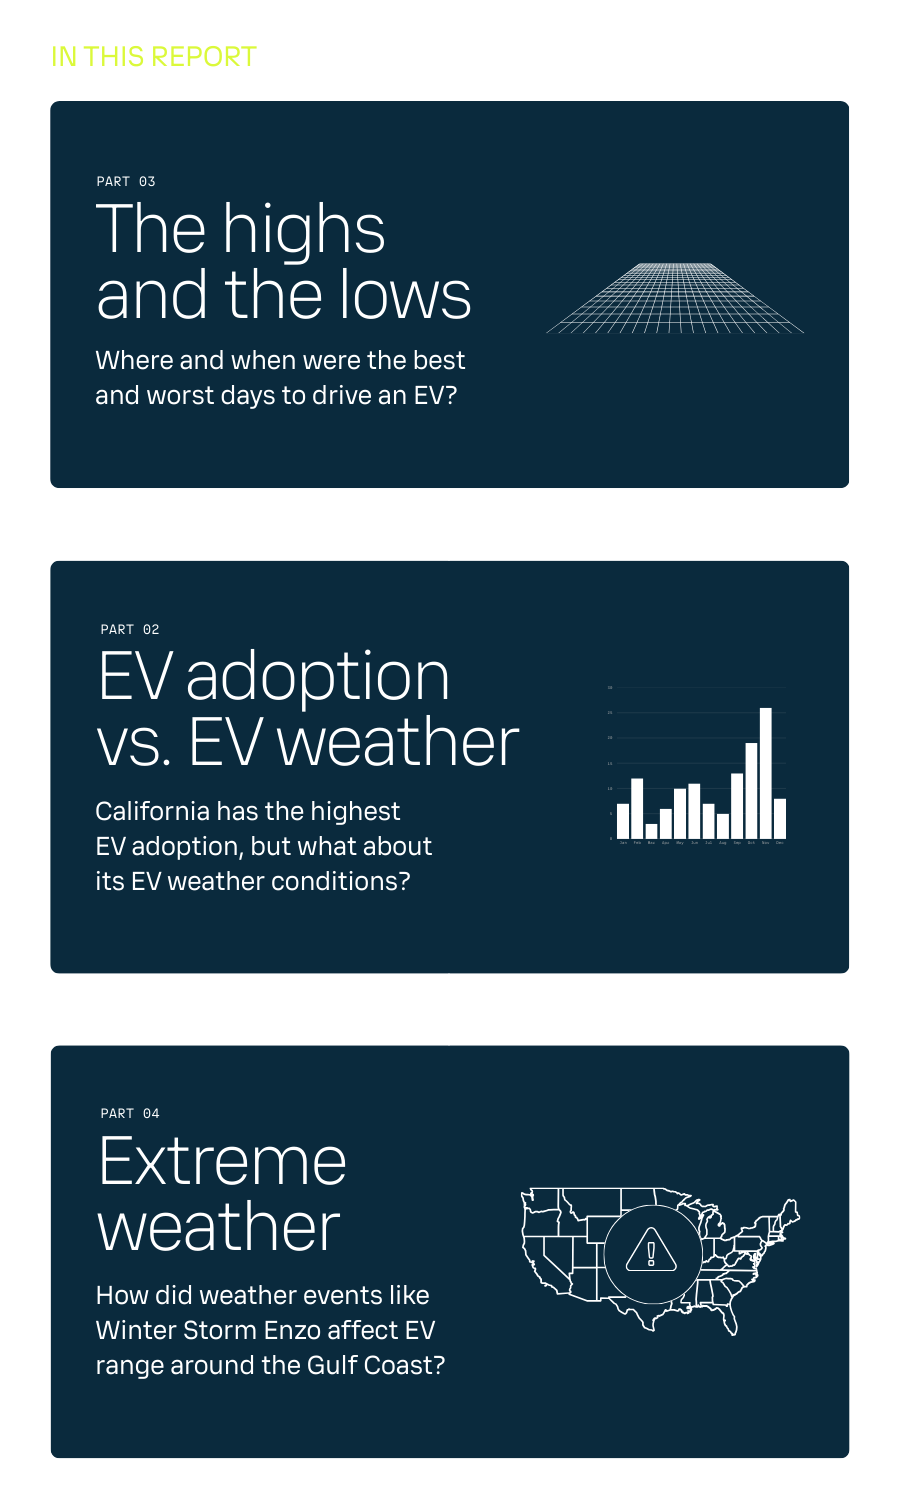
Introduction
How much further do you get in the summer compared to winter?
Weather and road conditions affect how far EVs can drive because they affect how the battery works and how much energy the car needs. In cold weather, the air is more dense and heating the cabin uses up power. Hot weather also reduces range since the air conditioning and cooling systems need extra energy. Water and snow on the road increase rolling resistance, making the car work harder to keep moving.
Weather affects the energy demand of gas-powered vehicles equally through air drag and rolling resistance, but the speed of refuelling makes an extra stop at a gas station less of a problem. Additionally, since their engines lose most of the fuel's energy as heat, there’s an added bonus of "free" cabin heating in winter from the engine's waste heat.
This report analyzes the effect of weather and road conditions on the range of an electric vehicle (EV) in the USA. We isolate the contribution of weather from the other factors that affect the range at different times of the year and across all the states in the contiguous USA.
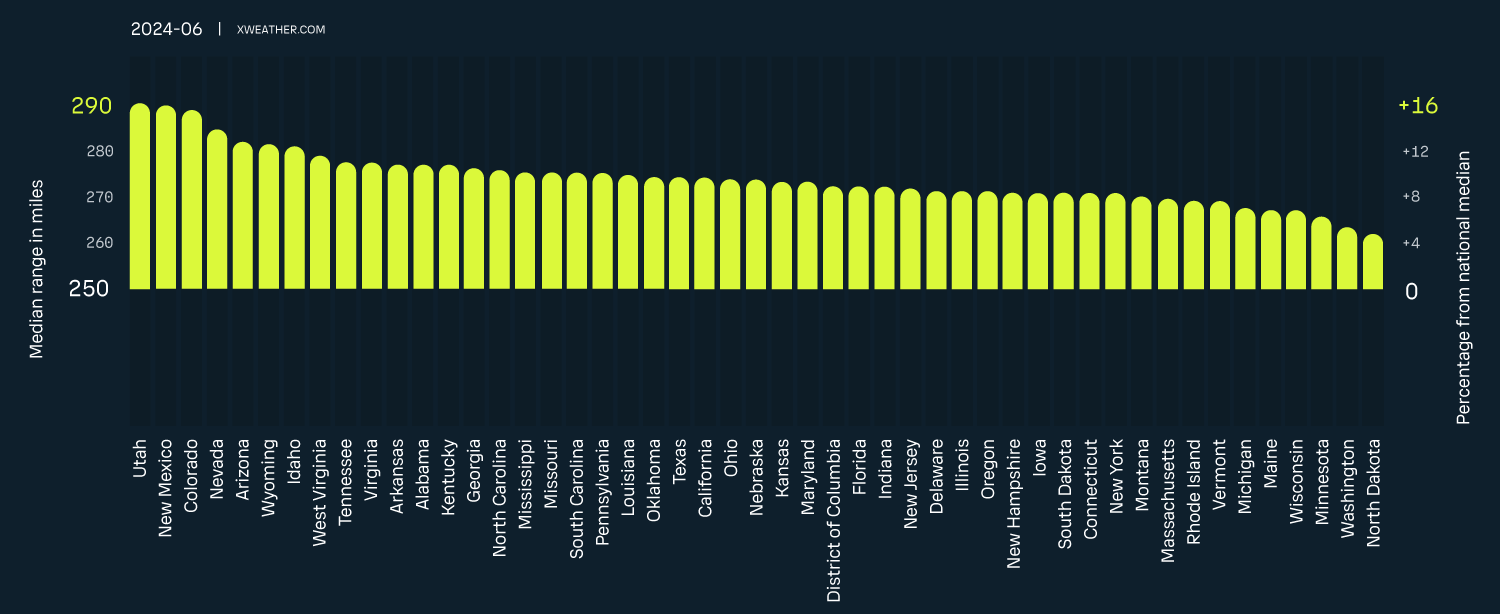
For this report’s mileage calculations, we modeled an EV with a median range of 250 miles, meaning half of the data falls above this threshold and half below. The visualizations also highlight this threshold for clarity. Given the significant variability across vehicle models, the graph scales include the percentage above or below the median range baseline, making it easier to apply the findings to EVs with different mileages.
Part 02
EV adoption and EV weather per state
Examining EV adoption rates alongside state rankings for EV-friendly weather shows that weather is not the only factor influencing vehicle choice. While California, the state with the highest EV adoption, enjoys favorable EV weather, several states with even better EV weather conditions have much lower adoption rates.

Part 03
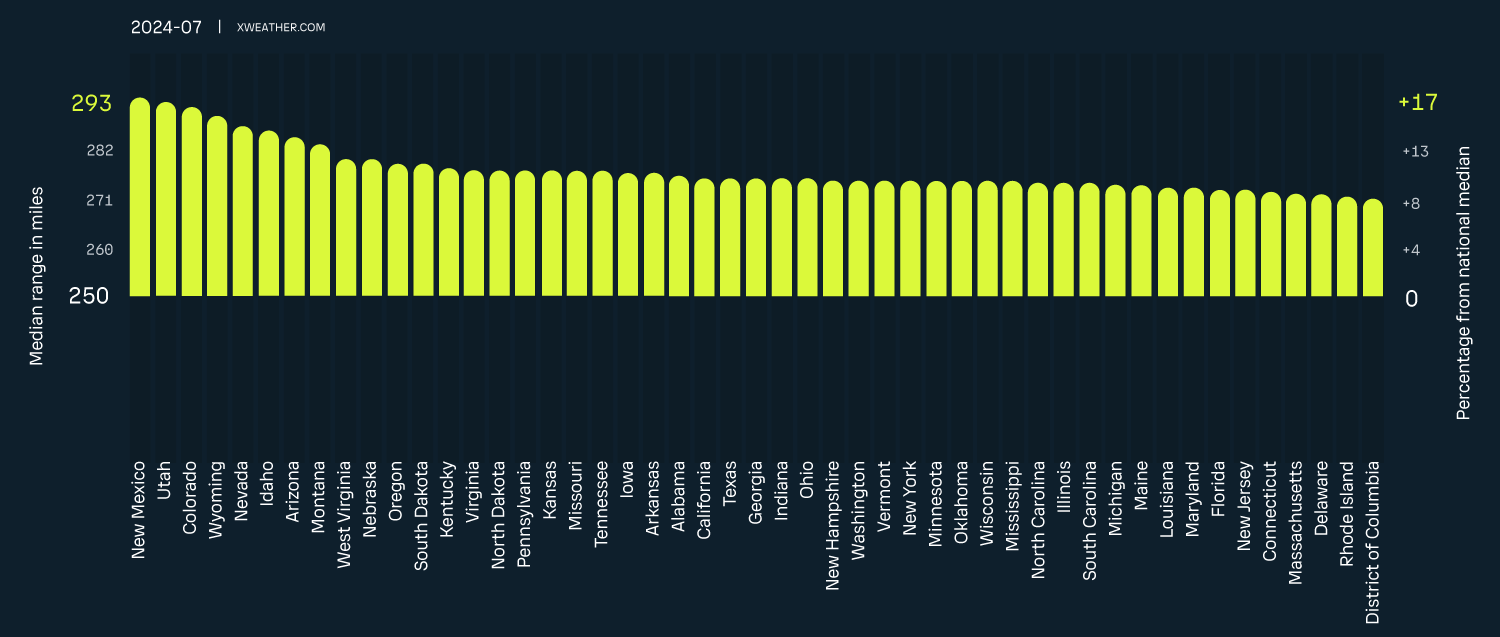
July 2024
In July, EV range remained well above average across all states, with New Mexico, Utah, and Colorado leading due to their high-altitude, low-air-density conditions. With no extreme cold to limit efficiency, EVs performed at their peak nationwide, though rising summer temperatures began to introduce minor range reductions in hotter regions. For example, Florida dropped to the seventh-lowest position, its worst ranking in this study.
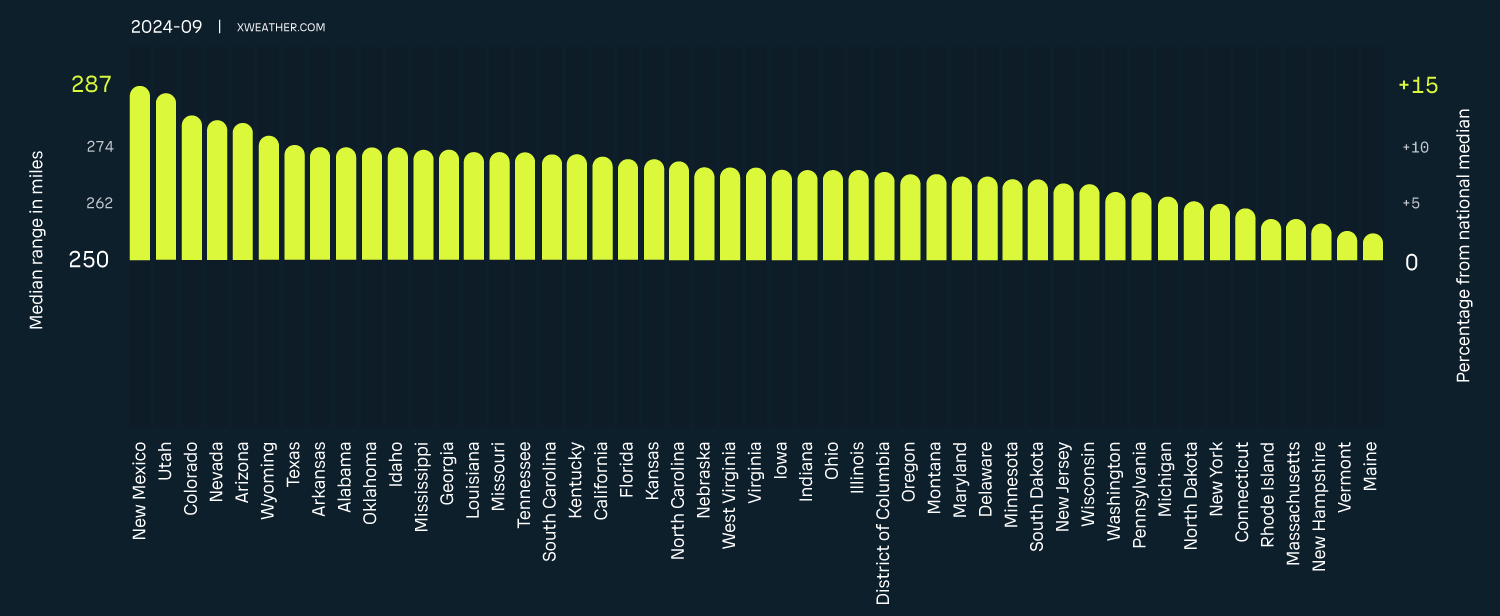
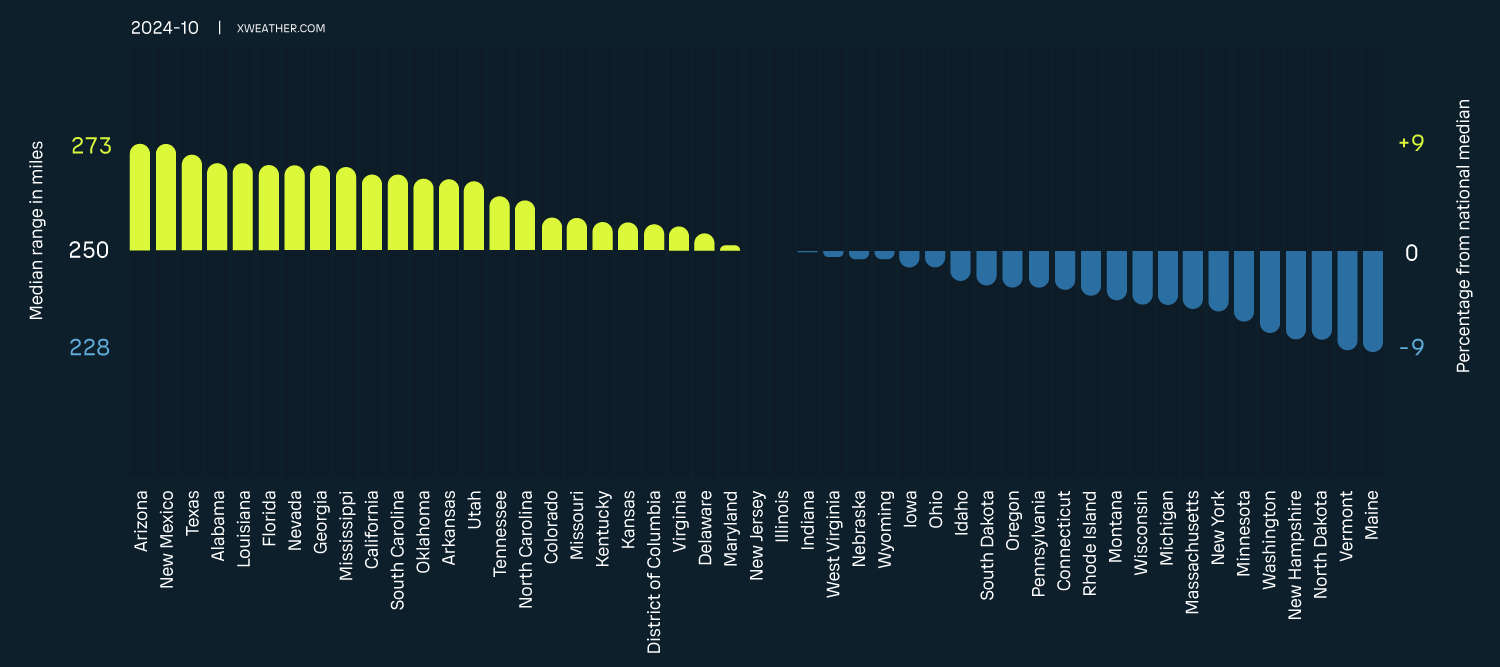
September 2024
In September, EV range remained high across the country, with New Mexico, Utah, and Colorado still leading due to favorable altitude and temperature conditions. As summer heat eased, reduced cooling demands helped maintain efficiency, but colder temperatures and wetter roads began to impact northern states. At the end of the month, Hurricane Helene caused a significant range decrease across large areas from Florida through the Carolinas.
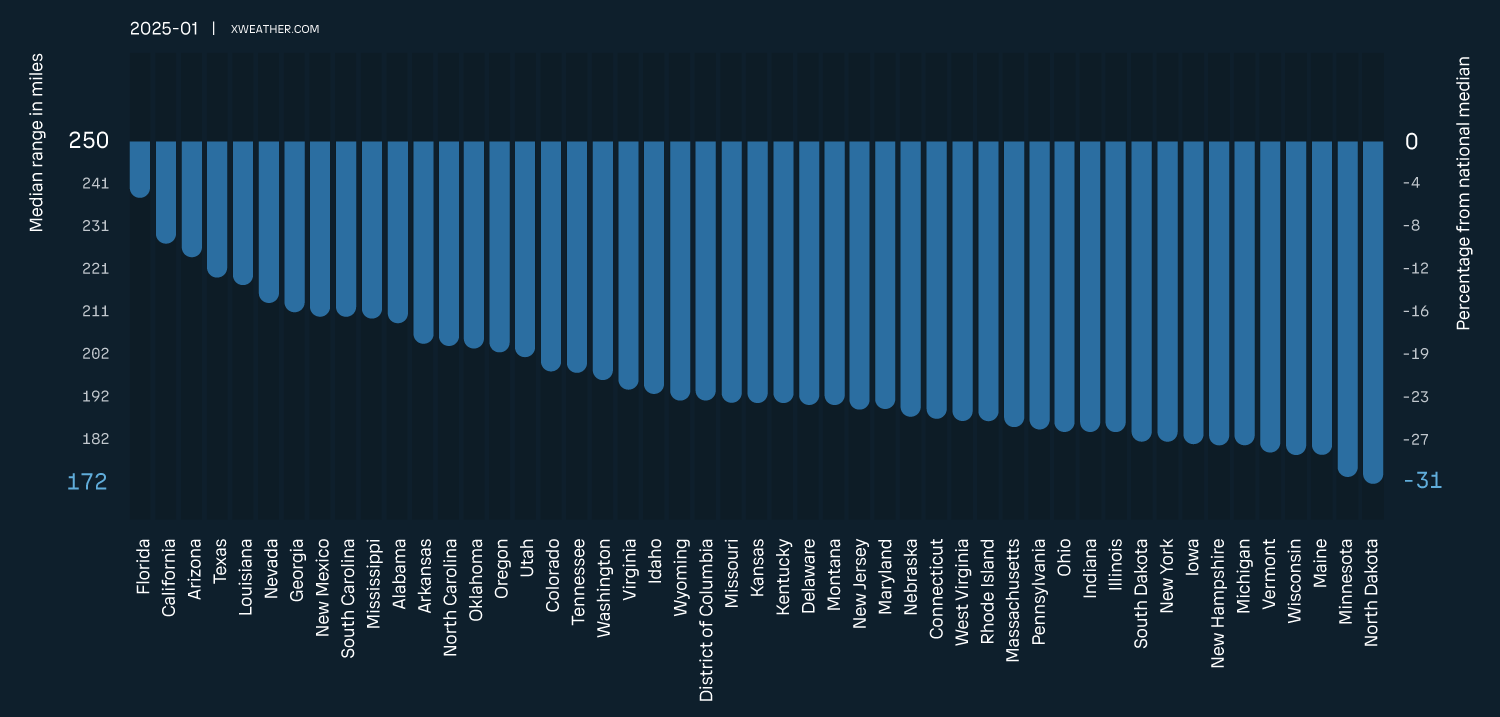
January 2025
In January, EV range reached its lowest point, with North Dakota, Minnesota, and Maine experiencing the steepest declines due to extreme cold. Even in Florida, the median range dropped below average. The Enzo winter storm further worsened conditions in the Southeast, contributing to below-average range in the region, including Florida.
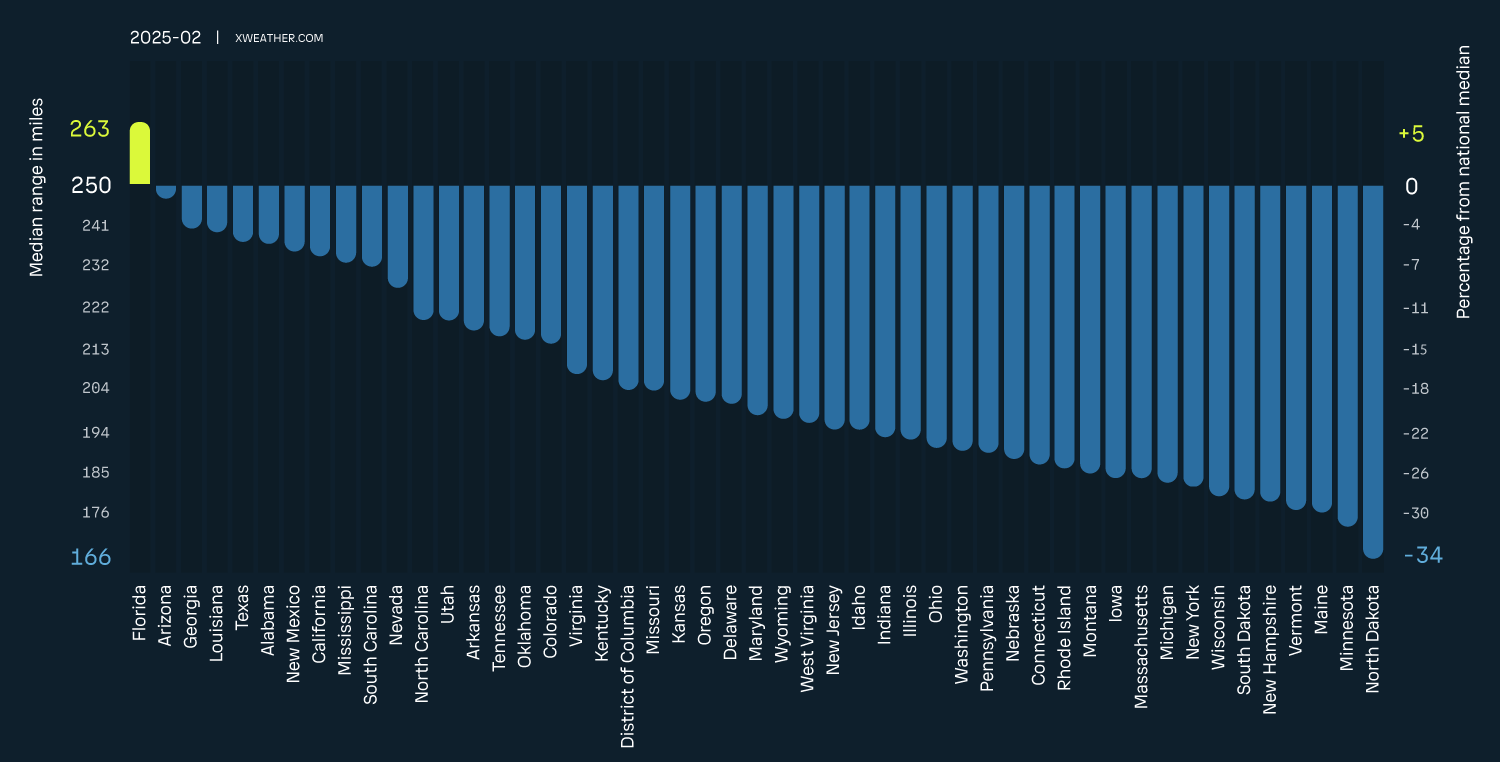
February 2025
In February, EV range remained low across most northern states, with North Dakota, Minnesota, and Maine experiencing the largest declines due to cold. Florida continues to lead with minimal winter impact, while other southern states start to see slight improvements as temperatures begin to rise.
Did you know?
Part 04
Daily EV range animation
This animation brings to life the daily impact of weather and road conditions on electric vehicle (EV) range across the contiguous United States from March 2024 to February 2025. Watch as seasonal shifts, regional climate patterns, and extreme weather events shape EV performance throughout the year, revealing the dynamic relationship between the environment and electric mobility.
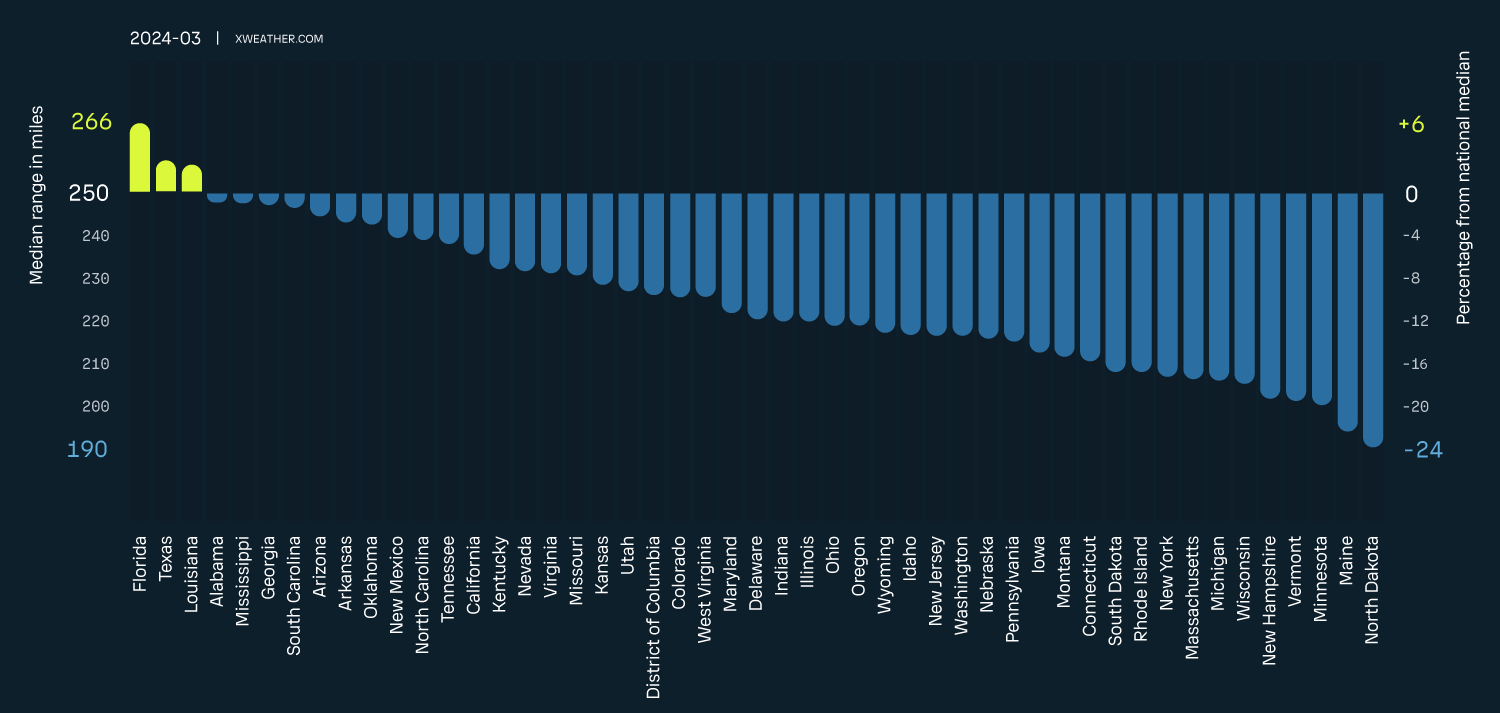
Winter storm Enzo
Due to the winter storm from January 20–22, EV range dropped below 100 miles on some roads in Florida and Louisiana. The event was extreme enough to impact whole-month medians, with EV range in Alabama and Mississippi falling below 190 miles.
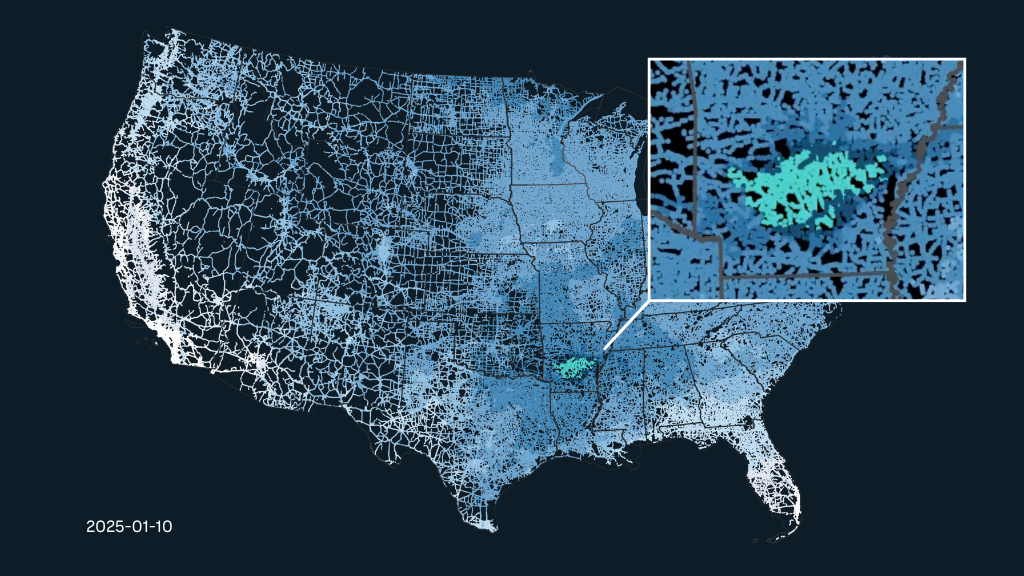
Heavy snowfall in Arkansas
Due to heavy snowfall in Arkansas, the rolling resistance of EVs increased by up to four times on some road segments compared to snow-free conditions at the same temperature.
Hurricane Helene
The devastating Hurricane Helene is clearly visible as a swath of reduced EV range extending from Florida through the Carolinas. On September 26th and 27th, Florida recorded the lowest range per road segment, dropping below 150 miles. Needless to say, but driving in those conditions would have been extremely dangerous—you really shouldn’t have been on the road!
Part 05
How did we calculate this?
The Average EV and data source
The range of an EV varies significantly by model. However, the impact of road weather on range remains consistent across models—for example, wet roads reduce range regardless of battery capacity.
For this report, we modeled an “average EV” to calculate mileage. To account for variability across models, we established a baseline using the dataset’s median range and expressed results as percentage deviations from this baseline. By definition, half of the data falls above the median range and half below. For ease of interpretation, we set the baseline to 250 miles and included both miles and percentage deviations in the graphs.
The report is based on the Vaisala Xweather Road Weather service for North America. Many of the world's largest automotive brands rely on Vaisala Xweather data to improve safety, efficiency, and comfort for drivers and passengers.
Road and route selection
The analysis focuses on roads with speed limits of 55 mph or higher, as range is primarily a concern during longer trips on highways.
To isolate the effects of weather and road conditions, all road segments are assumed to be driven at a uniform speed. If actual driving speeds were used, the results would reflect the proportion of high-speed versus lower-speed roads in each state, making it difficult to separate the influence of weather and road conditions from the state's road network characteristics.
To get the average range, we considered both traffic directions simultaneously which largely cancels out wind effects. Not entirely, however, as headwinds cause more resistance than tailwinds provide assistance (1), and side winds are also detrimental (2). Energy gain and loss due to elevation changes was ignored partly based on the same principle of bidirectional travel, but primarily because this report focuses specifically on weather-related effects.
Data collection and processing
The following road weather effects were included in the range calculation:
air drag
air density, based on ambient air temperature and air pressure at the elevation of the road segment
wind at vehicle height
rolling resistance
road surface temperature and ambient air temperature
water film thickness
snow depth
(3)
cabin climate control and battery thermal control
ambient air temperature
solar radiation
Average driving range was calculated for each selected road segment in both directions every 15 minutes over one full year, resulting in over 14 billion range estimates.
The data was collated per state and per month for insights into seasonal and regional variations. Day-to-day variability was assessed to identify best-case and worst-case scenarios, and to create the whole-year animation.
Footnotes
(1) Air drag increases as the square of velocity, meaning a headwind increases aerodynamic drag disproportionately compared to a tailwind of the same speed. For example, if a vehicle traveling at 55 mph encounters a 10 mph headwind, the effective speed for drag calculations becomes 65 mph. The drag force is proportional to the square of the effective wind speed, so the drag at 65 mph is significantly higher than at 55 mph. Conversely, with a 10 mph tailwind, the effective speed is 45 mph, and the decrease in drag is less pronounced due to the same square relationship. This explains why headwinds have a greater negative impact on energy consumption than tailwinds provide as a benefit.
(2) Vehicle aerodynamic design typically minimizes air drag from the front. As a result, sidewinds create additional turbulence, increasing total aerodynamic drag beyond what the headwind component alone might suggest. Regardless of vehicle shape, since drag force increases with the square of wind speed, any sidewind component adds to drag if the vehicle moves faster than the tailwind. These effects raise energy consumption, even when the wind is from the side or slightly behind.
(3) The impact of water film thickness and snow depth on EV energy consumption is capped, as thicker layers are assumed to slow driving speeds, offsetting increased rolling resistance with reduced air drag. Additionally, it is assumed that during heavy snow events, most people avoid driving until roads are plowed.
Part 06
Want to use the EV range dataset?
The Xweather EV Range dataset provides detailed weather and road conditions data, which EV manufacturers can use to optimize vehicle systems, improve efficiency, and predict EV range more accurately. Dataset available in North America, Europe, Japan, Australia, and New Zealand.
Learn more about the dataset or request access by filling the form below.
Request access to the EV range dataset
Here’s how to access the Xweather EV Range dataset and the benefits of using real-time and forecasted weather and road conditions in electric vehicles.
Step 1
Fill in the form with your details to request access.
Step 2
We will reach out to you to set up your access.
Step 3
Get continuous support from early validation to performance testing and on to production.
Automotive-grade weather partner
Many leading automotive brands trust Vaisala Xweather data to enhance safety, efficiency, and driver comfort. With nearly 90 years of weather innovation, decades of expertise in road weather sensors and precision forecasting developed alongside road and safety professionals, Vaisala sets the standard in weather-driven mobility solutions. To help you share key insights from our EV report, we’ve prepared this EV range report media kit: