We have recently released substantial upgrades to our air quality API endpoints and map layers. These enhancements offer a more detailed, accurate, and intuitive experience in global air quality monitoring. Keep reading to learn about these cutting-edge improvements and discover how they can revolutionize your interaction with air quality data.
airquality/index endpoint
The new airquality/index endpoint is a notable addition. It provides real-time access to the Air Quality Index (AQI) and category based on the EPA's AirNow calculations. This endpoint is available globally and included in all Weather API and Maps subscriptions.
Using the airquality/index endpoint to obtain the current Air Quality Index for Minneapolis, Minnesota is as follows:
air-quality-index map layers
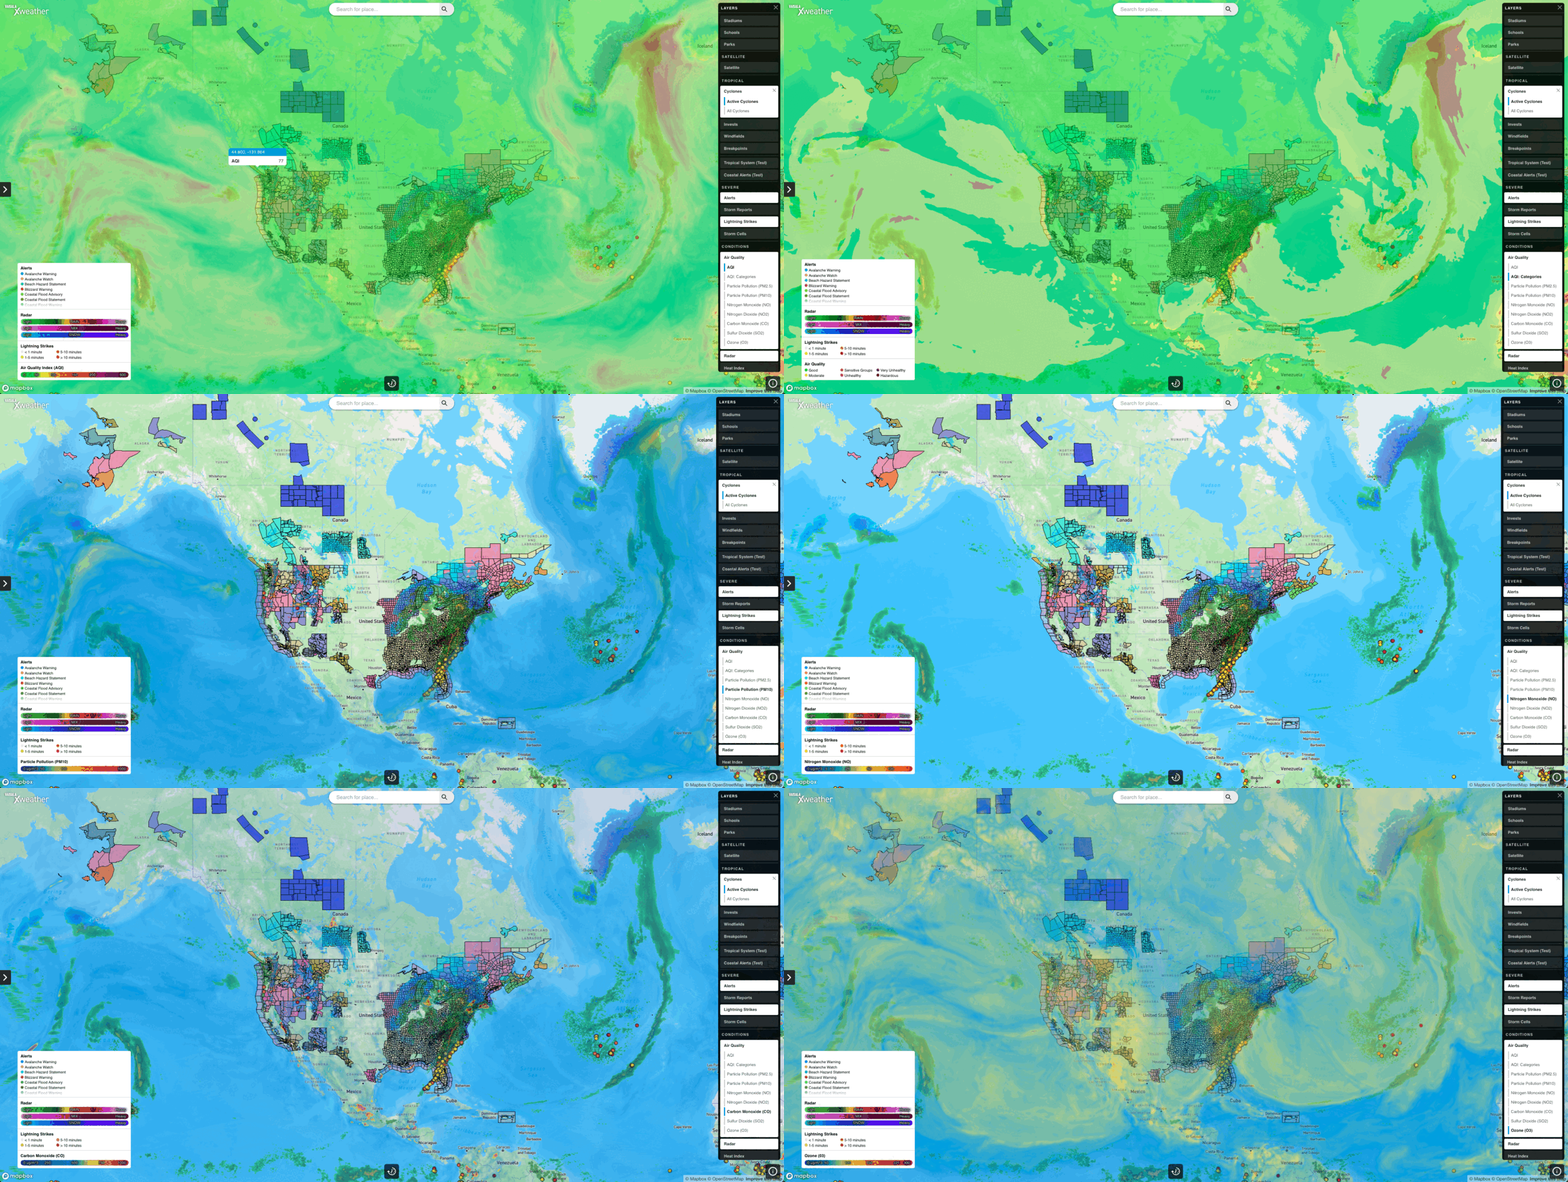
In parallel to the new airquality/index endpoint, Xweather has also revamped its air quality index map layers. These improved layers are now part of Xweather API and Maps subscriptions, offering a more detailed view of global air quality broken down into the EPA's AirNow categories. The layers are named air-quality-index-categories and air-quality-index, with the latter providing smooth air quality data transitions rather than strict category transitions.
Introducing fresh air quality data and layers
Our latest air quality releases expands the capabilities of Weather API and Maps subscriptions, enabling access the following.
Air Quality Health Index (AQHI)
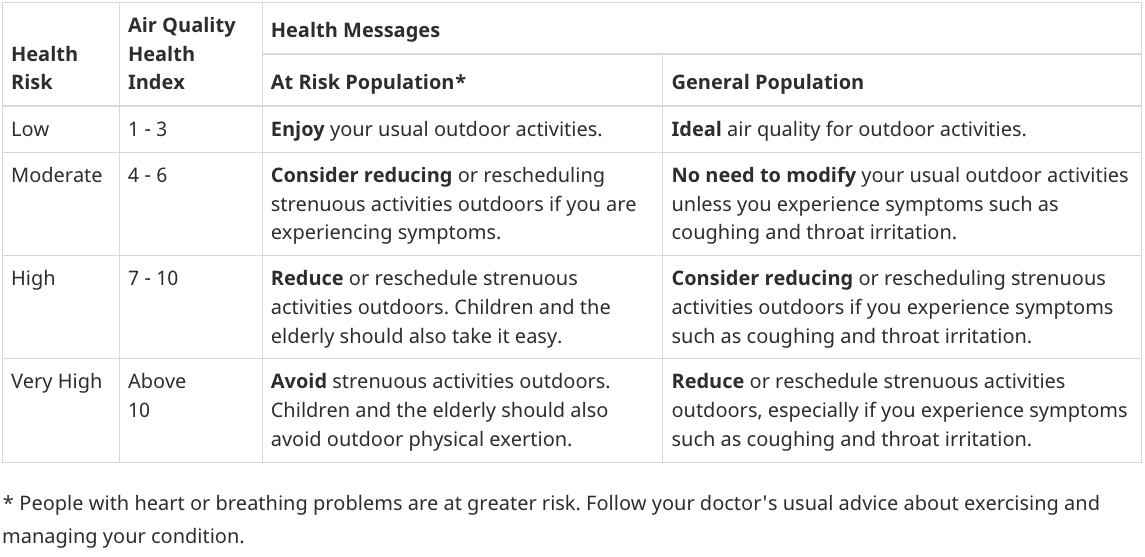
The most significant addition is the global Air Quality Health Index (AQHI), which is accessible through the airquality endpoint. This index offers a health-centric approach to understanding the impact of air pollution. Based on the AQHI level, it includes actionable health advice for various groups, such as children and older adults. The index ranges from 1 to 10, corresponding from 'Low Risk' to 'Very High Risk,' with each category offering specific health advice. The breakdown can be viewed in the table image and table from Environment Canada below:


More information on AQHI can be found at https://www.canada.ca/en/environment-climate-change/services/air-quality-health-index.html
Expanded air quality and air quality forecast endpoints
In addition to now including AQHI, the airquality endpoint also integrates Xweather's high-resolution air quality models. These updates offer at least 4x higher spatial resolution and are updated hourly. Additionally, the API now supports expanded regional AQI calculations, including AirNow, South Korean Comprehensive Air-quality Index (CAI), CAQI (Common Air Quality Index), China, EAQI (European Air Quality Index), Germany, India, and the UK.
To request air quality information using a regional calculation, pass filter=xyz where xyz is the filter name for the regional calculation needed. For example, to obtain the air quality for Beijing, China using the China calculations:
Regional air quality calculations are available for both the airquality and airquality/forecasts API endpoints.
Individual pollutant information and layers
Xweather has also improved the detail of individual pollutant information within the air quality and air quality forecasts endpoints. New individual pollutant layers for raster maps and MapsGL are now available. These layers cover the pollutants PM2.5, PM10, CO, NO, NO2, O3, and SO2, providing a comprehensive view of air quality.

The enhancements to the Xweather weather API and MapsGL represent a significant step forward in air quality monitoring and analysis. These updates not only provide more detailed and accessible data but also emphasize the health implications of air pollution, empowering businesses, individuals, and communities alike to make informed decisions about their environment and health. Test out our air quality data and layers — and everything else our API and mapping suites have to offer — with a free 30-day trial.
