One of the most difficult challenges in renewable energy forecasting is making accurate short-term predictions when conditions are changing rapidly.
Part one of this series showed that renewable energy forecasting technology and accuracy have improved significantly over the last few decades. Therefore, it is unsurprising that companies providing these services can show impressive accuracy statistics and many examples of good forecasts. But what about the forecasts that missed the mark? What can we learn from a better understanding of bad forecasts?
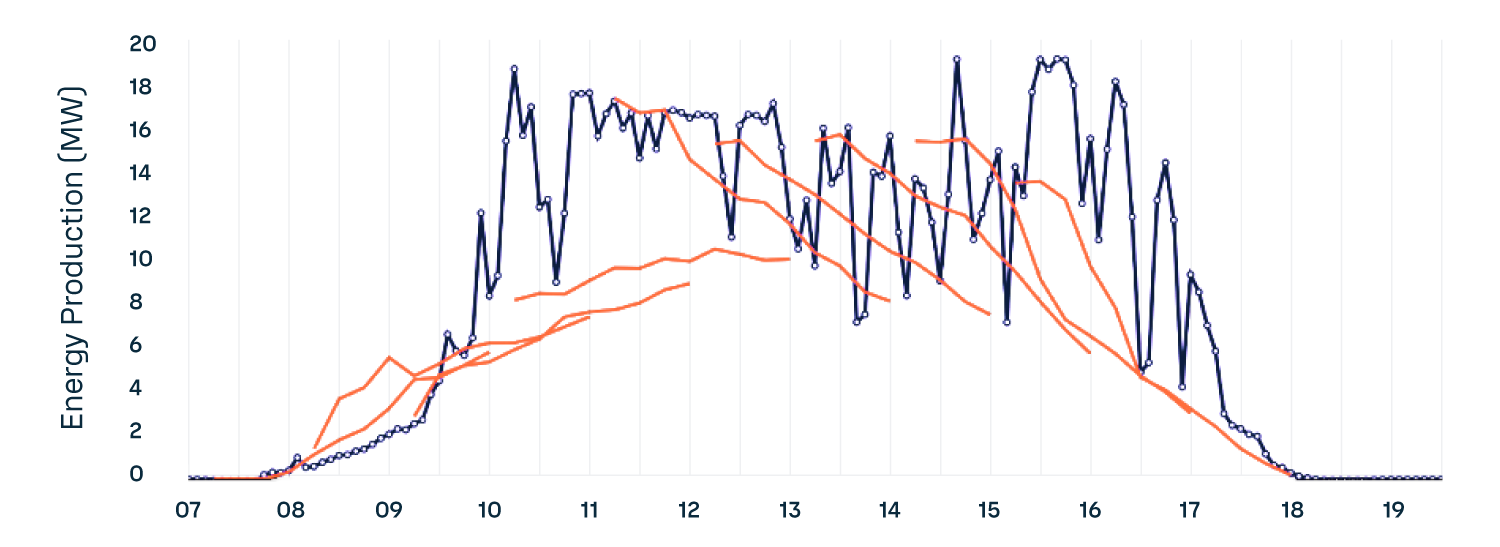
The forecast below shows a poor attempt to predict the next three hours of solar energy output on a partly cloudy day. Yuck! So, what makes this a bad forecast? Let's explore that and discuss how we can improve it.

Figure 1. An example of a "bad" short-term solar energy forecast. Orange lines are 3-hour long forecasts made at several times in the day, compared to the five minutely average observations in dark blue.
Bad forecasts don’t just look bad, they cost money. Bad forecasts can turn into bad maintenance schedules, over- or under-commitment to day-ahead markets, and sub-optimal dispatch of energy storage. They incur a real cost.
As with many things in life, we learn from our mistakes, or at least we hope to. Even with bad forecasts, it is easy to blame someone else for those failures. “Sorry, the global model busted. If they can’t get the weather forecast right then we can’t get the energy forecast right!” “Sorry, the renewable energy project was curtailed. No one could have predicted that!”
However, often the methods and tools required to improve the forecasts, to turn bad into good, are very much in our control.
For example, in the case of busts in the global weather forecast models, we are not at the mercy of just one global modeling center. We can use other models, employ machine learning to fix repeatable busts and run our own weather models at the global and/or regional scale. Sometimes, we use NWP as the engine, and these days, we even use AI.
If a project gets curtailed unexpectedly, instead of predicting power, we can predict potential power (which is affected only by the wind or sun resource), or even predict curtailment itself.
ECMWF is - as its acronym stands for - an incredible model for medium range weather forecasts, and was never designed to predict things at very short lead times.
ECMWF is - as its acronym stands for - an incredible model for medium range weather forecasts, and was never designed to predict things at very short lead times.
And sometimes we just need to dig a bit deeper. The European Centre for Medium-Range Weather Forecasts (ECMWF) delivers an incredible model for medium-range weather forecasts and was never designed to predict conditions at very short lead times.
Like other global and regional scale weather forecasts, ECMWF forecasts don’t capture rapid changes in the weather. When the output from the renewable energy project is changing quickly and almost randomly, the machine learning models are going to have a hard time figuring things out. They need to be fed a signal to make sense of all the noise coming from the NWP and the observations. Without that signal, we are going to see some bad forecasts.
Taking renewable energy forecasts from bad to good
Let's go back to that forecast example in Figure 1.
Today, one of the most difficult challenges in renewable energy forecasting is making accurate predictions at very short time scales (a few minutes to hours ahead) when conditions are changing rapidly. Figure 1 demonstrates predicted solar energy output at short time frames on a partly cloudy day. The output can look like random noise. Global and regional weather prediction models don’t handle clouds very well and are not updated often or quickly enough to predict the evolution of clouds over short time scales.
In Figure 1 we see a forecast (orange lines at fifteen-minute intervals) compared to observations (white dots at five-minute intervals) at a location in the US. The forecasts are the result of a machine learning model trained to the on-site observations, ECWMF global forecasts (updated four times per day), and US-focused HRRR forecasts (updated hourly). In late 2023, these forecasts performed very well in a competitive trial of multiple vendors, being the most accurate at most sites, including the site shown in Figure 1. And yet, I call them bad forecasts.
The machine learning models simply don’t have the information required to create an accurate forecast. Each forecast starts at roughly the right point but is being pulled toward an incorrect NWP solution. This baseline forecast does not know where the clouds are right now (beyond the information in HRRR). As a result, it cannot predict how clouds in the vicinity of the project might evolve in the next few hours. The outcome? Sub-optimal participation in short-term markets, inefficient storage in batteries, or underutilization of Power-to-X (P2X) systems such as hydrogen production from clean energy.
Learning from this bad forecast and improving is exactly what we did. We decided to include information about cloud evolution in our machine learning models. It’s one thing to look at a satellite image and determine that there are partly cloudy conditions around the project. It is another thing entirely to predict where those clouds are going and how they are changing over time.
We built a short-term cloud forecasting model, which we call Cloud Nowcast. We used deep learning approaches that take a history of satellite images captured every five minutes to predict the next three hours in five-minute intervals. We did this for several channels of satellite data. The goal was to build a forecasting system that can predict the next frames of the satellite image—like predicting the next frame of a movie or the next word in a sentence. In developing this cloud nowcasting system, we specifically aimed to significantly improve upon the current state-of-the-art optical flow model.
It’s one thing to look at a satellite image and determine that there are partly cloudy conditions around the project. It is another thing entirely to predict where those clouds are going and how they are changing over time.
It’s one thing to look at a satellite image and determine that there are partly cloudy conditions around the project. It is another thing entirely to predict where those clouds are going and how they are changing over time.
Cloud nowcasting with optical flow (left) and a deep neural network (right)
Optical flow looks at where clouds were and are at a given moment. It then extrapolates forward using simple motion vectors.
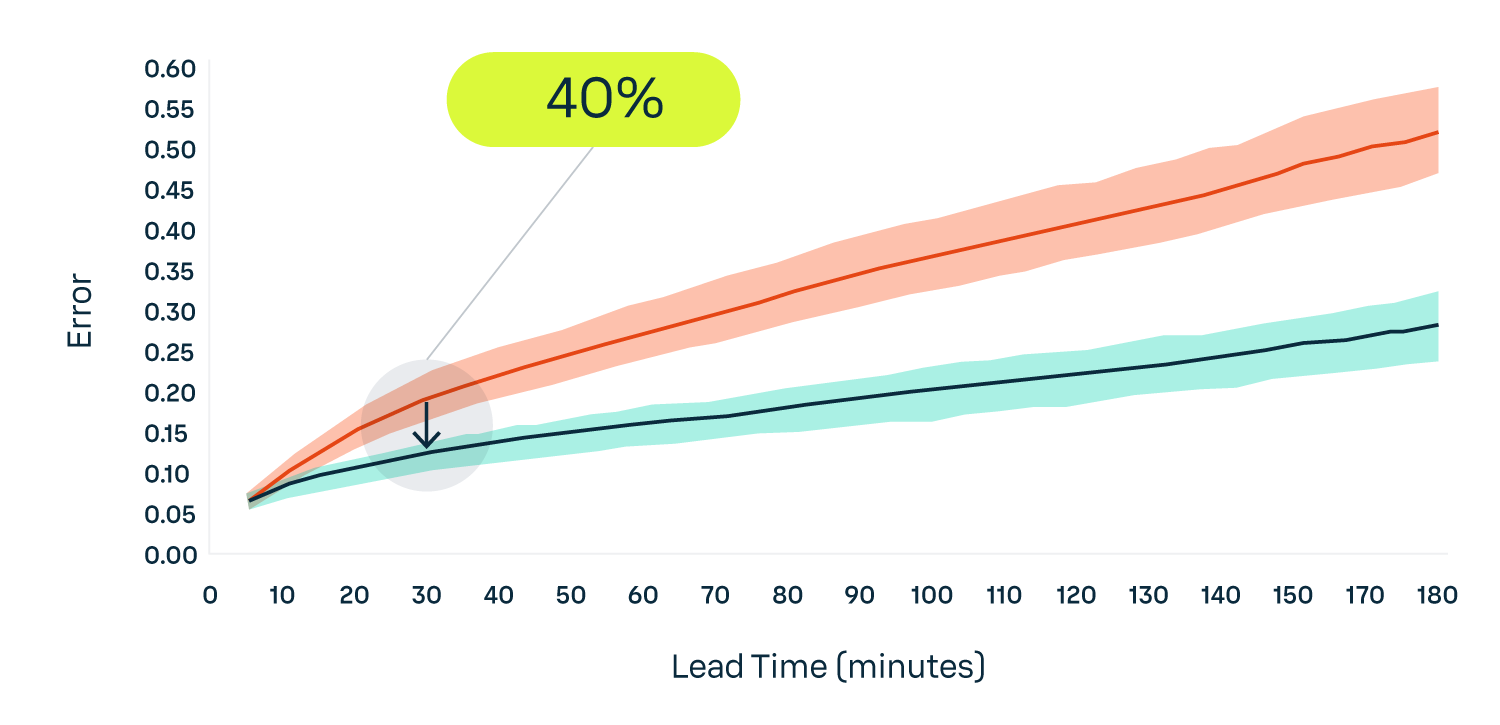
Deep learning tries to figure out how clouds evolve on its own, but with a steep learning curve and huge data inputs and computational requirements. The chart below shows the relative error of a cloud nowcast using deep learning (in aqua-green) versus optical flow (in orange). Lower values are better, and our deep learning approach is the clear and consistent winner: 30 minutes in advance, we see up to 40% reduction in mean absolute error.

Figure 2. Vaisala Xweather's renewable energy forecasts use a cloud nowcasting algorithm trained with deep learning techniques. This algorithm consistently outperforms the industry standard optical flow models by a significant margin.
Improving energy forecasts with cloud nowcasting
Does improved cloud nowcasting result in improved energy forecasts?
Now that we have a cloud nowcast that updates every five minutes, we can use it as an input to our flexible machine learning model to predict energy output. Finally, we have signals that might explain and predict the noise of the observations. Compared with the baseline in Figure 1, does cloud nowcasting improve the accuracy of the energy forecast? And what does it look like? Is it visually better?

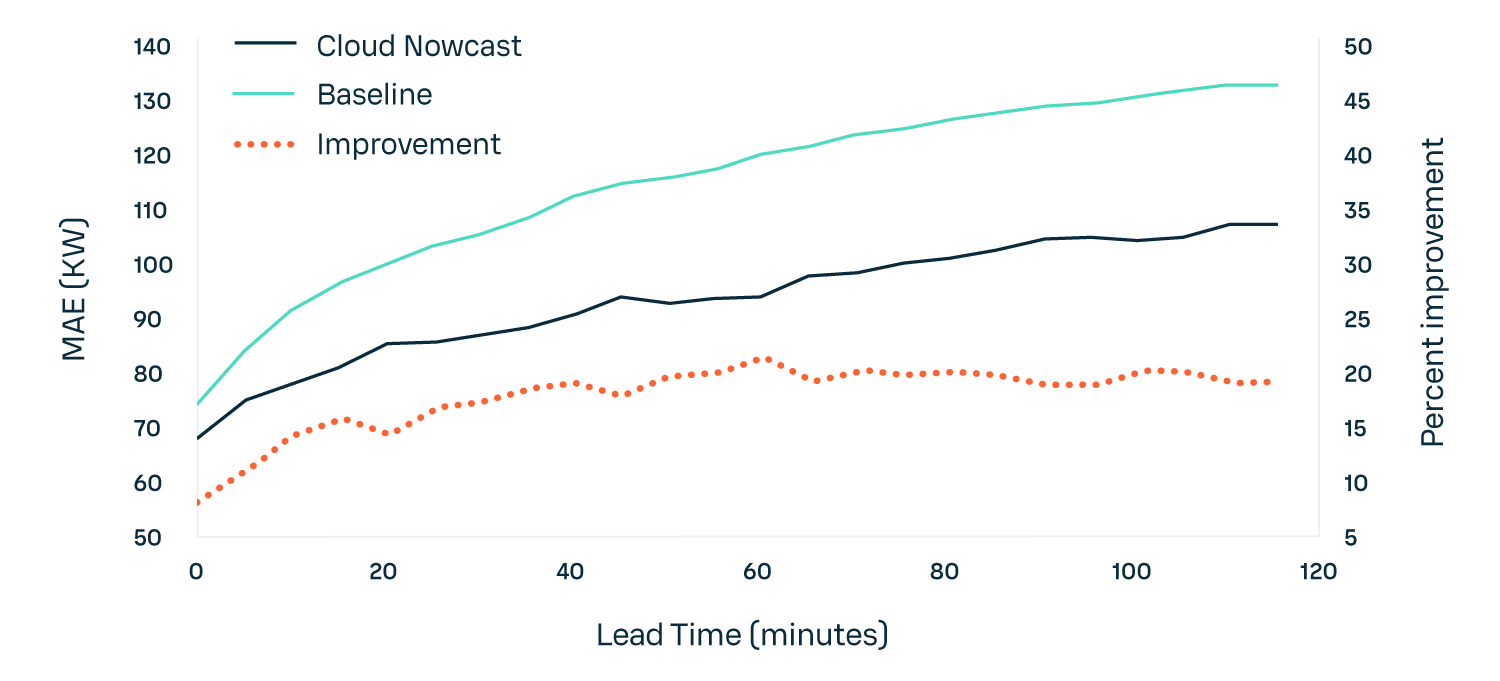
Figure 3. Improvement in short-term solar energy forecasting using cloud nowcast versus baseline that uses only site observations and NWP forecast models.
The chart above compares the two forecasting systems for all lead times from the next five minutes to two hours ahead. The mean absolute error is reduced by up to 20%. In this industry, improvement is generally measured in single digits. A 20% reduction is a real breakthrough. But statistics don't tell the whole story, so let’s look at actual forecasts on the same day as our baseline.

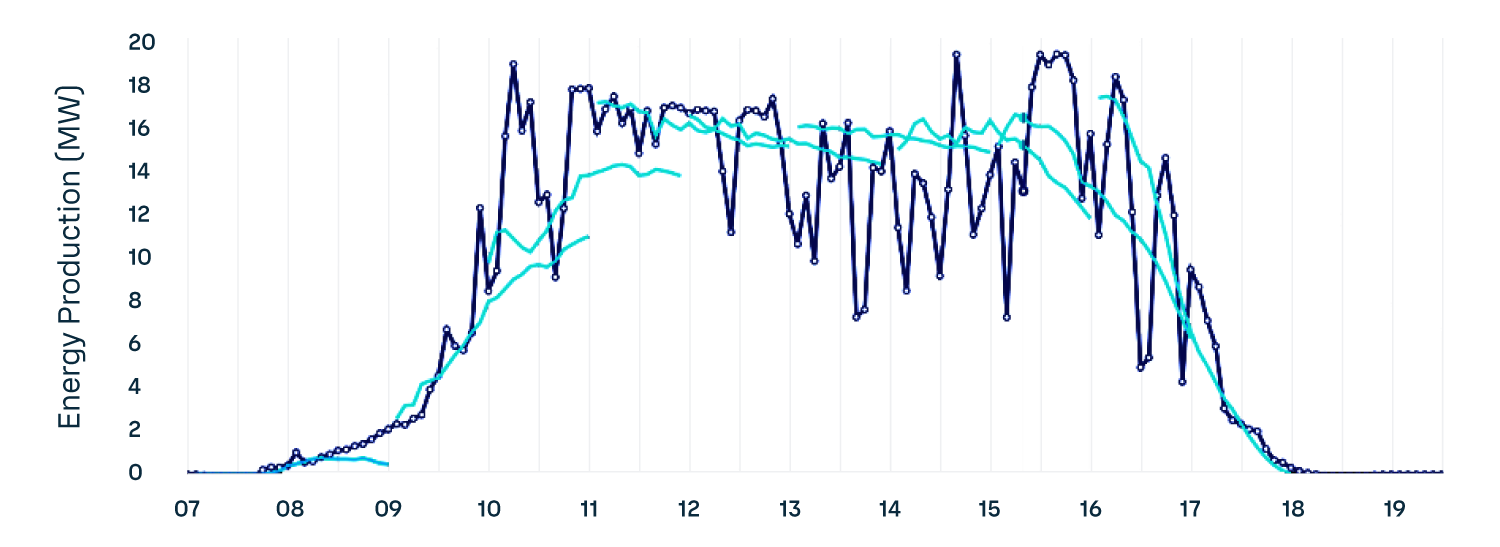
Figure 4. The cloudcast enhanced short term energy forecast for the same forecasts as shown in Figure 1. Here, the forecasts stay close to the observations, whereas in the "bad" baseline they clearly drifted away.
In this chart, the aqua-green lines are forecasts for the next three hours for each five-minute interval. These forecasts are a significant improvement compared to the baseline in Figure 1. The forecasts start at the right point and consider the general cloudiness occurring over the next few hours, improving on the general NWP forecasts that negatively impacted the baseline. While this forecast is undoubtedly better, there is still room for improvement. And continue to improve we will.
Will it ever be possible to predict these short-term fluctuations a few hours or days in advance? Or must we leave it to the system (batteries, the grid, and the market) to deal with this inherent variability?
Find out in 'The truth about renewable energy forecasting. Part three: "The Ugly."'


