Top-tier renewable energy forecast providers do the hard work to constantly improve to stay on the cutting edge.
One of the most common questions for weather forecasters (and renewable energy forecasters) is, “Who is the most accurate forecast provider out there?” While this seems like a great question, it is an oversimplification, just like asking “Who is the best marathon runner in the world?” While it is easy to point to the fastest time ever run over 26.2 miles, the individual that holds that record does not win every race. The reality is more complex with real-world course and weather conditions, and the fitness of the competitors, all coming into play to determine the winner of a given race. While “the best” will vary from race to race, what is clear is that the top performers work hard to stay at the front of the field.
This three-part series tells the story of the good, the bad, and the ugly of renewable energy forecasting—a story of what it takes to be continually amongst the best in the world, the lessons learned through lots of practice, and an honest look at the limits of forecasting.
The good: We’ve come a long way
The good news is that forecast accuracy has increased dramatically over the last few decades. Weather forecasting was funded by governments and the private sector all over the world and received significant investments; in measurement systems (like satellites, radars, radiosondes, ground stations, and ocean buoys); in R&D to understand the physics and dynamics of the Earth’s terrestrial, oceanic, and atmospheric systems; and in data ingest, data assimilation, and supercomputing systems that brought weather forecasting into the modern digital age. The investments in these areas continue today with an emphasis on space-based observation platforms, machine learning systems, and probabilistic forecasts.
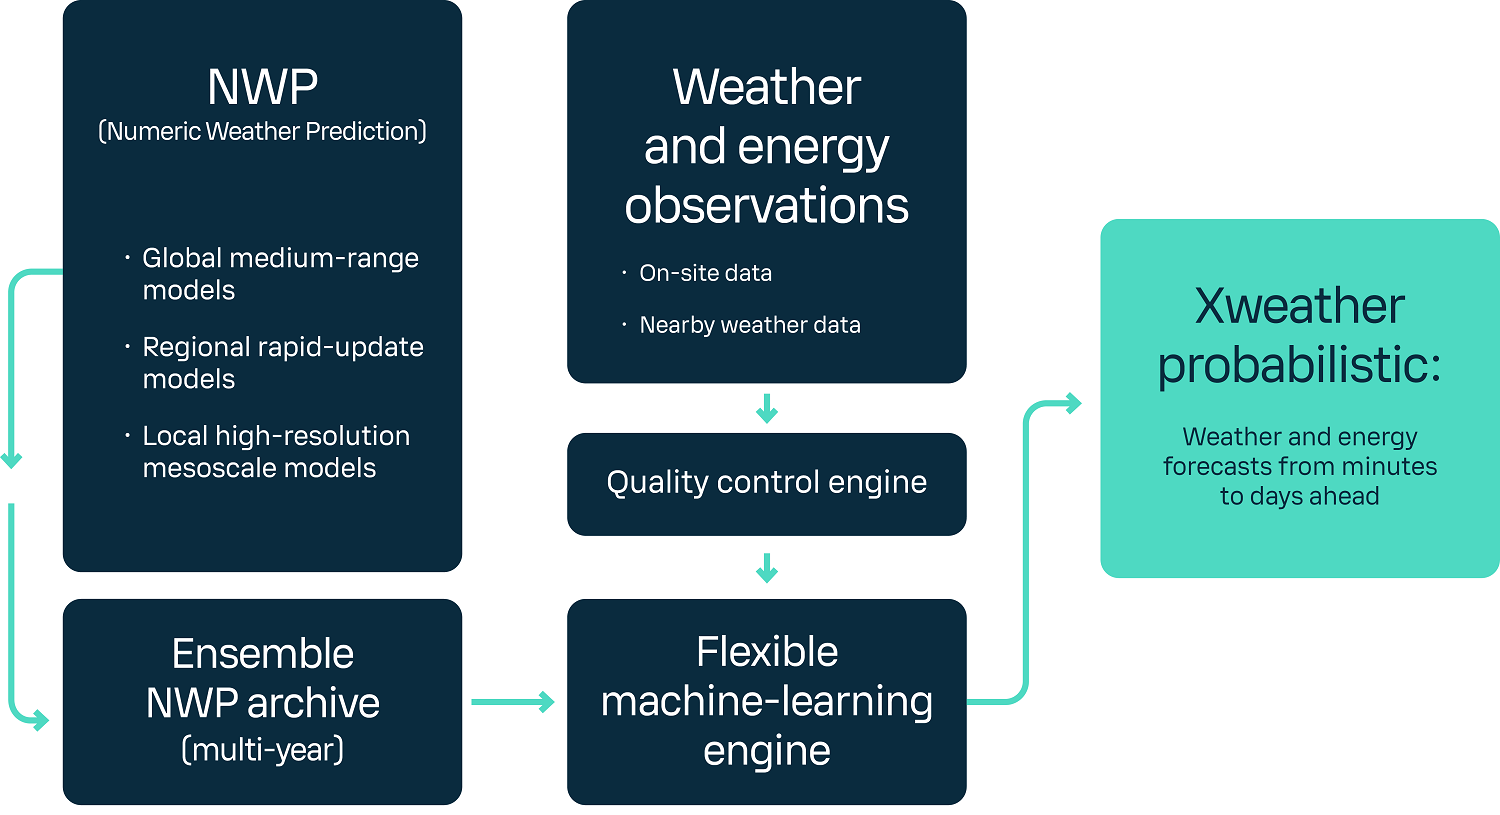
Diagram of the Vaisala Xweather renewable energy forecasting engine.
Vaisala Xweather's renewable energy forecasting approach relies on three pillars.
First, we use weather forecasts from esteemed global and regional modeling centers such as the European Center for Medium-Range Weather Forecasts (ECMWF), the UK Met Office (UKMO), and the US National Center for Environmental Prediction (NCEP), among others.
Second, we take on-site or regional weather and energy observations as the target for our predictions.
Third, we employ machine learning models that continuously learn from the data provided by the first two pillars.
All this data is compiled into a multi-year archive and used as an input (and target) for a versatile machine-learning engine. This process undergoes continuous enhancements to deliver the most accurate probabilistic forecasts possible.
... there's no such thing as a perfect forecasting system, nor will there ever be one.
... there's no such thing as a perfect forecasting system, nor will there ever be one.
It's important to understand that there's no such thing as a perfect forecasting system, nor will there ever be one. Instead, we continually refine our methods through research and development. Every aspect of our approach improves: global and regional forecasts are more precise, observations are better, algorithms are refined, and machine learning adapts to new data and computing advancements.
Thanks to this ongoing global investment, what could only be predicted one day in advance in 1980 can now be forecasted with the same level of accuracy five days in advance. Similarly, what could be predicted just one or two hours ahead in 1980 can now be forecasted a full day in advance.
We engage in a continual cycle of research and development to refine our methods. Every aspect of our approach is in a state of constant improvement.
We engage in a continual cycle of research and development to refine our methods. Every aspect of our approach is in a state of constant improvement.
When examining our own progress in forecast accuracy over time, we see a notable improvement. A decade ago, errors stood at 20% for the day ahead timeframe and 10% for the hour ahead timeframe. Now, our errors have reduced to approximately 8% for the day ahead and 5% for the hour ahead timeframe. In simple terms, we can now predict a day in advance with the same level of accuracy that we could predict an hour in advance a decade ago.
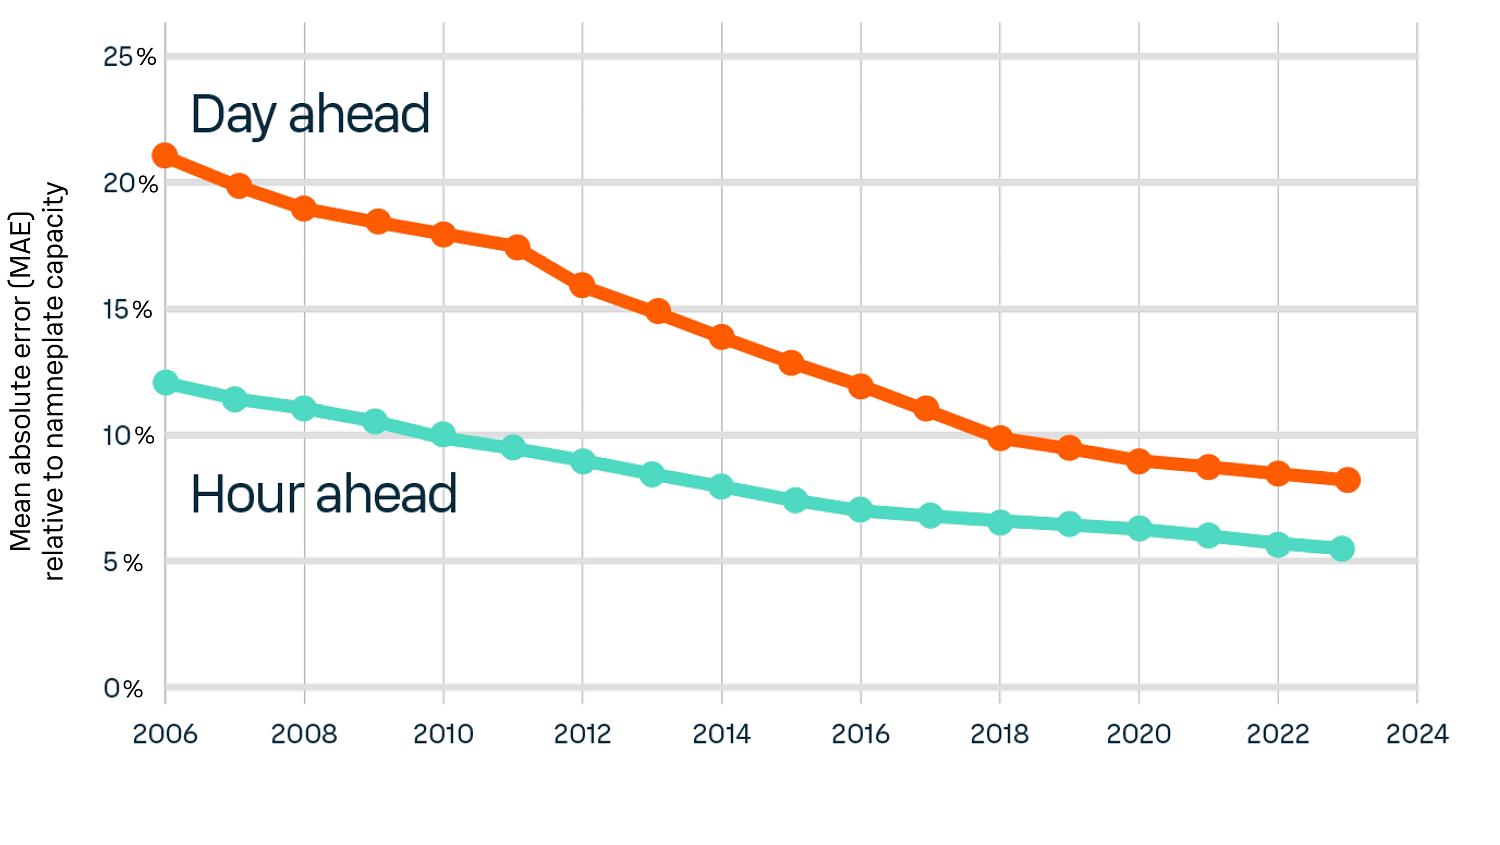
This chart shows how the accuracy of Vaisala Xweather renewable energy forecasts for typical utility-scale wind farms has improved over time. The percent error is relative to nameplate capacity.
What does a good renewable energy forecast look like at the scale of an individual wind or solar farm?
The chart below shows 11 days in the life of a 35 MW wind farm. The blue dots represent the actual power output every five minutes. This period shows significant volatility in wind energy production at this location, with frequent fluctuations in output. Predicting such variability, even a few hours in advance, is challenging. The forecast, generated at the present moment ("NOW"), extends six days into the future. The deterministic forecast, indicating what we think will happen, is depicted by the green line. The light-green shaded area represents the prediction interval, indicating what we think might happen. This interval is calibrated based on past forecast errors, ensuring that observations fall within the prediction interval 80% of the time.
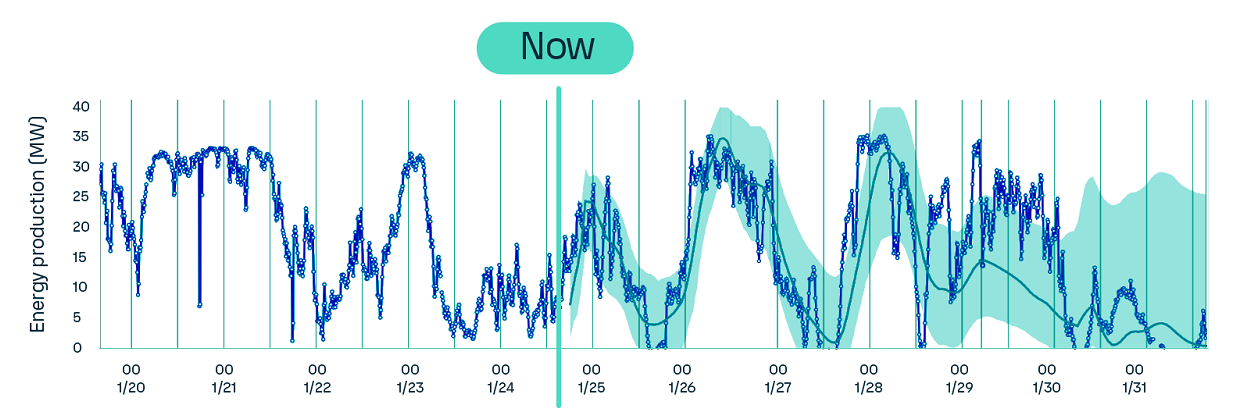
An example of a good wind energy forecast issued "NOW" and extending out 6 days into the future. A full 11-day period is shown for context. Hourly average forecasts are shown relative to 5-minute observations.
For the first day (and even two or three days) the general shape of the forecast is quite good, including the timing of up and down ramps. There is a lot of variation at the five-minute scale, but the timing of those short fluctuations is impossible to predict a day or two in advance. During this period, the prediction interval tends to be narrow and precise.
Looking out four or five days in the future or even longer, we see the forecast starting to diverge from the observations. Not only is the deterministic forecast departing from the observations but the prediction interval is growing wider too.
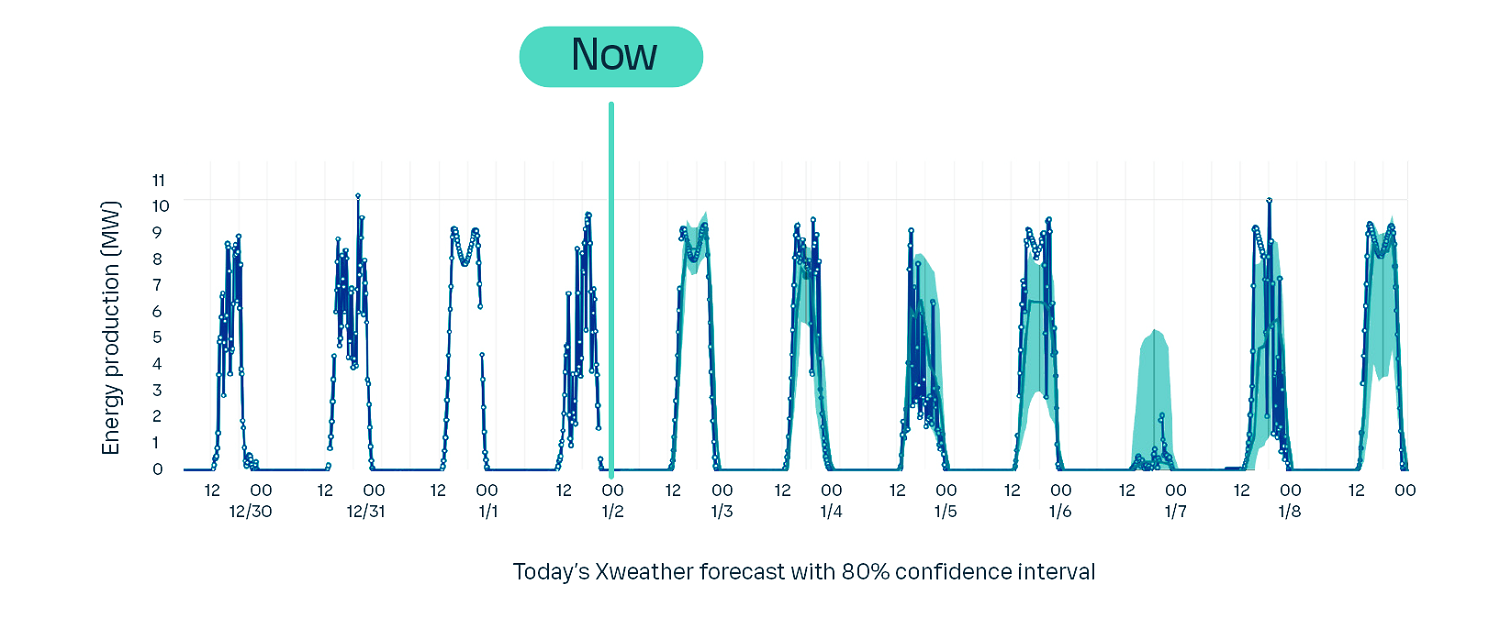
An example of a good solar energy forecast issued "NOW" and extending out 7 days into the future. A full 11-day period is shown for context. Hourly average forecasts are shown relative to 5-minute observations.
The chart above illustrates a similar example of a successful forecast for a solar energy project. The forecast accurately predicts energy production for the first day and effectively accounts for reduced energy output due to overcast conditions on the second and third days.
On the fourth day, however, our forecasting system predicts cloudier conditions than actually occur, resulting in a deviation from the actual energy production.
The forecast is nearly perfect again on the fifth day. On the sixth day, the forecast underestimates energy production, and on the seventh day, it accurately predicts full sun conditions.
Clearly, the accuracy of renewable energy forecasts has significantly improved, enabling us to generate remarkably precise predictions even several days in advance. However, there remains ample opportunity for further enhancement. 'Good' forecasting will perpetually evolve as a dynamic benchmark. So what makes a good forecast even better? Learning from bad forecasts and further refining our techniques.
Find out more in 'The truth about renewable energy forecasting. Part two: "The Bad."'

