Get road surface roughness data for your entire network without leaving your desk.
What if I told you that from the very first day you start using RoadAI, you'll see surface roughness data for your entire road network without having to perform a single survey?
Our latest update integrates connected car telemetry from almost two million vehicles to deliver International Roughness Index (IRI) scores and trend data for your road network from day one.
In this post, I'll show you how RoadAI provides an instant, network-wide view of surface roughness and how combining this IRI data with video footage and detailed defect data gives you the complete picture you need to plan, prioritize, and budget with confidence.
Fresh data every week with zero effort
Connected vehicles collect and transmit telemetry continuously as they travel. We aggregate suspension data and process it into IRI measurements, the global standard for pavement roughness.
The principle mirrors dedicated profiling equipment, but with two clear advantages: coverage and frequency. Specialist survey vehicles only measure a set route at one specific time. Connected car data, collected from a fleet of almost 2 million vehicles, not only provides more comprehensive coverage but also updates in near-real time. With aggregated reports available weekly in RoadAI, you always have an up-to-date view of your network's condition.
The problem with traditional road profiling
Here's the problem with traditional road profiling: a single pass only measures the thin path below the sensor, not the entire width of the lane. Getting an accurate measure requires multiple passes until the average stabilizes. But this is a slow and expensive process when using specialist equipment.
Connected car data solves this problem naturally. Data from thousands of vehicles, each one following a slightly different path, averages out lateral variability and delivers a more accurate representation than a single run by a dedicated profiler. This means you get reliable roughness data precisely where traditional surveys struggle: on the roads that need maintenance the most.
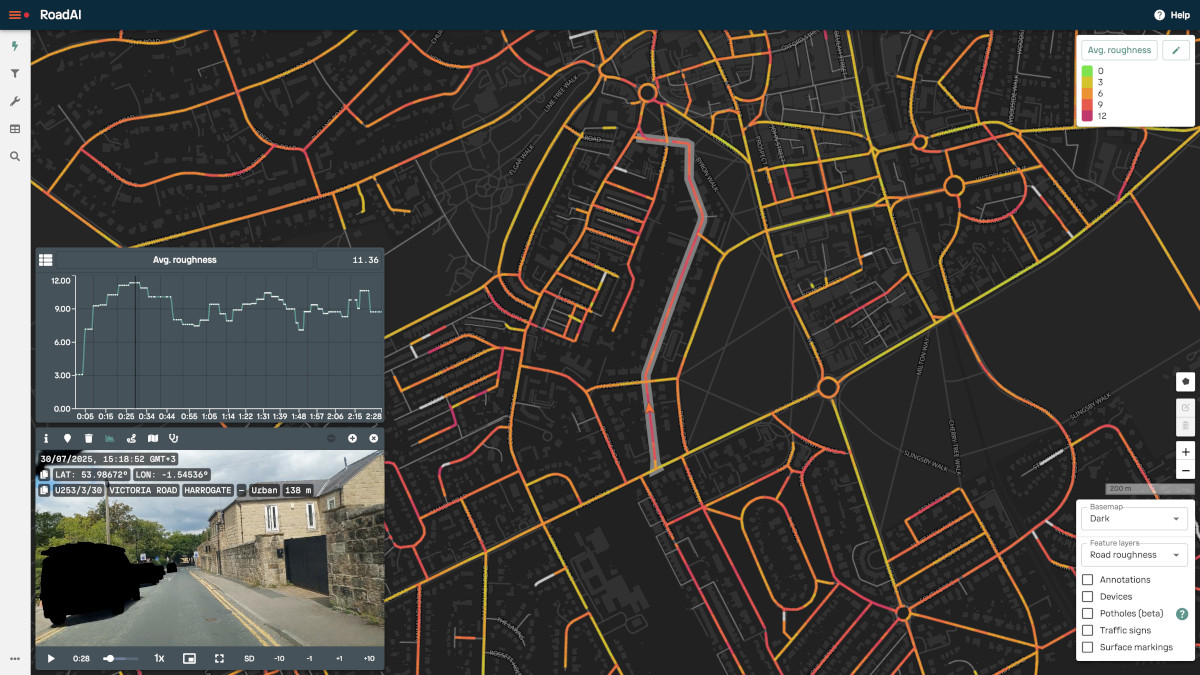
RoadAI displays International Roughness Index (IRI) values for your road network without you having to perform a single survey. Shown here is the average roughness, with green highlighting indicating low roughness, while yellow, orange, and red indicate increasing levels of roughness.
How to prioritize which roads to inspect first
High IRI values flag segments with likely defects. If it's been several months or even years since your last survey, this data tells you which roads to prioritize for inspections with the RoadAI app.
It's a powerful combination. Use roughness data to identify problem areas, then use the RoadAI smartphone app to capture the complete picture with detailed defect data, condition assessment, and a high-definition video record for planning and budgeting.
For municipalities without established programs, this data provides immediate visibility into which roads are degrading and where to focus limited resources.
The real value, however, lies in combining IRI data with defect details and video collected with the RoadAI app to assess issues remotely, set priorities, and manage your network more efficiently.
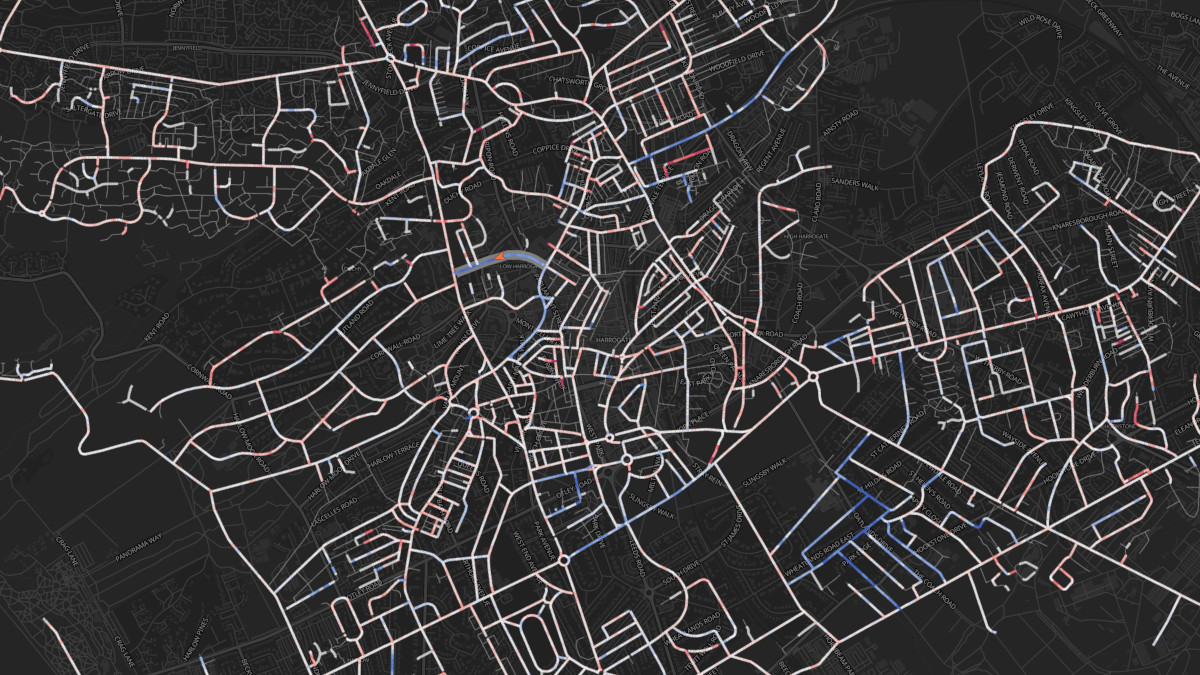
RoadAI shows changes in roughness over 3 months, 6 months, and 12 months. Red highlighting indicates roads that are deteriorating fastest. Blue indicates roads where roughness has improved, validating the effectiveness of your maintenance actions.
How to catch problems before they become safety hazards
Weekly data updates deliver fresh IRI scores across your network. You also get a historical perspective from day one. Trend data reveals which segments are degrading fastest. A road showing steady IRI increases over weeks signals accelerating deterioration, potentially indicating structural problems that require more than surface treatment. You can intervene early with data that proves the economic benefits of preventative action.
After resurfacing, the trend data validates effectiveness. You can check that the IRI scores improve as expected and remain stable. Long-term trends support planned maintenance strategies, helping you assess conditions across the network and prioritize work where it will have the greatest impact.
See how IRI data drives smarter inspections
Connected car data is just one part of RoadAI's complete approach to road asset management. Using your smartphone and computer vision, the RoadAI mobile app captures the whole picture—defects, road markings, assets, and more—in a single pass, giving you four times more data than traditional surveys at half the cost.
Book a demo and I'll show you real network data, demonstrate the key features, and explain how cities, municipalities, and road authorities use RoadAI to move from reactive repairs to data-driven preventative maintenance.