)
Early major hurricane activity in the Atlantic Basin
In 2024, June 1st marked the beginning of the Atlantic Hurricane Season, a time when awareness of coastal and ocean conditions is especially imperative. In late June, Tropical Storm Alberto, the first named storm of the season, brought coastal flooding and severe weather to the southern and western United States. By the end of June, the northern hemisphere had only produced three named storms, with Alberto being the only one in the Atlantic - the fewest in this timeframe since 1983.
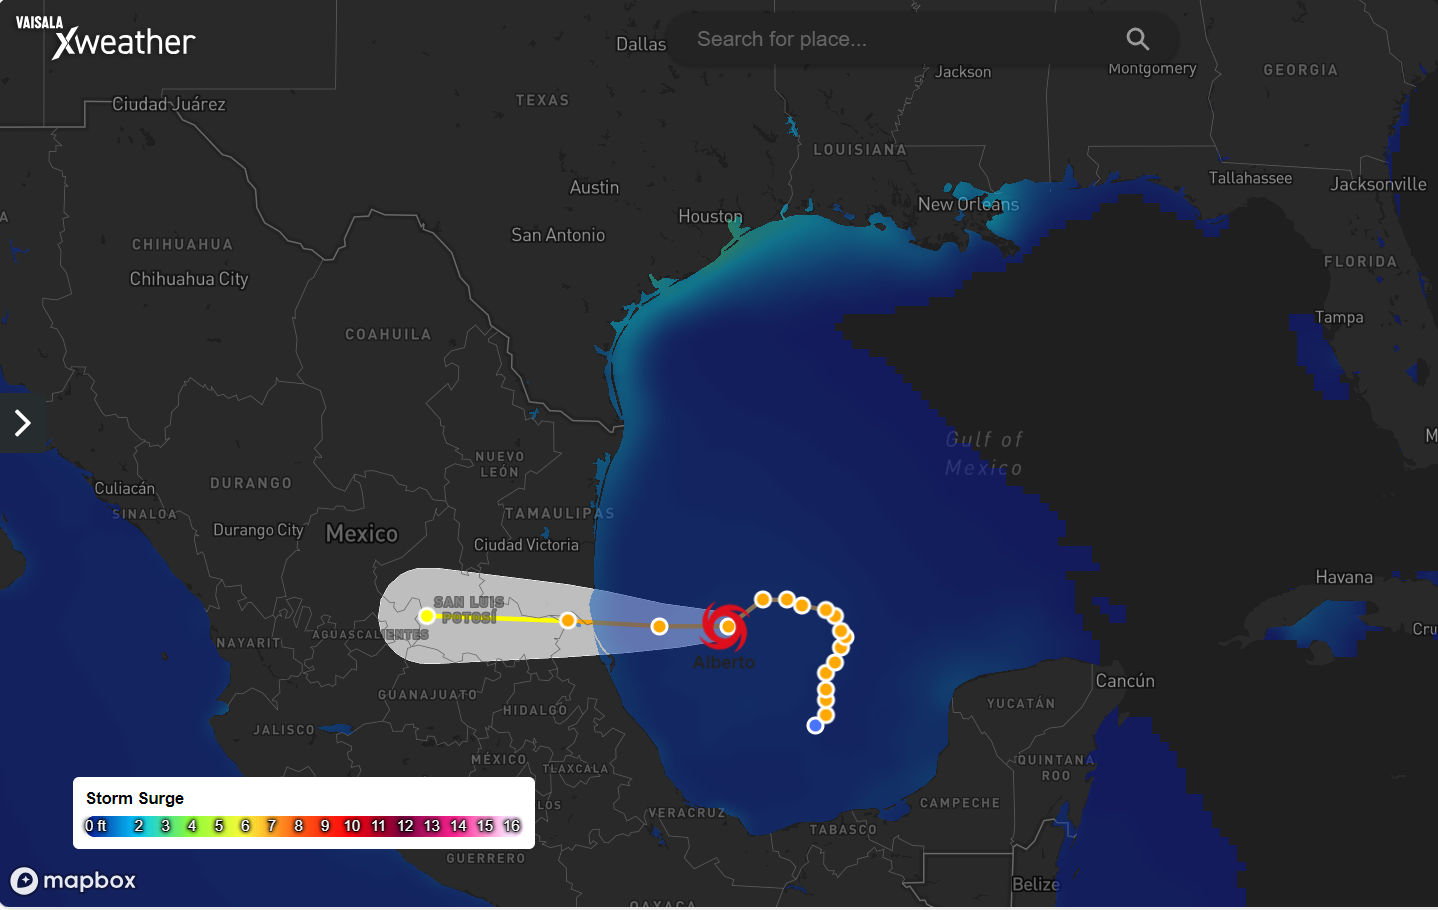
The track of Tropical Storm Alberto in the Gulf of Mexico in June with storm surge impacting Texas and Louisiana, visualized using Xweather MapsGL demos
However, the slow start was certainly not indicative of the remainder of the season. Noted first by the National Hurricane Center, Investigation Area (Invest) 95 L was described as a tropical wave south of the Cabo Verde Islands, producing disorganized showers and thunderstorms with a 20% chance of formation over the next seven days.
Over the following week this storm rapidly intensified, evolving from a tropical depression into the impressive Category 4 Hurricane Beryl in just 48 hours. By the next Monday evening, Beryl had escalated into a Category 5 storm, the highest rating on the Saffir-Simpson Hurricane Wind Scale. Beryl set a new record as the strongest Atlantic hurricane this early in the season, surpassing the previous record for the earliest Category 5 hurricane held by Hurricane Emily on July 16th, 2005.
Sea surface temperatures and visible satellite visualized using MapsGL, showing the development of Beryl from a tropical wave to a Category 5 Hurricane
This hurricane progressed and strengthened so quickly in part because of the high heat content in the ocean, which is currently comparable to levels we would normally record in late August into September. The Climate Prediction Center predicts an 85% chance of an above-normal hurricane season in 2024, with between 17 to 25 named storms expected.
So... what exactly is a tropical wave?
Tropical waves aren’t waves in the ocean, as the name might suggest, but rather, disturbances in the atmosphere. Hurricanes like Beryl often begin as tropical waves, also called African Easterly Waves, which can originate over 7000 miles away in East Africa. These disturbances eventually make their way to the US coast and are the precursors to 60% of the cyclones that form in the Atlantic. For tropical cyclones rated Category 3 and stronger, this percentage rises to 85%.
Tropical waves often originate from the African Easterly Jet, a region of strong easterly wind in the upper troposphere — the layer of the atmosphere where our weather occurs — over northern Africa. North of the equator, the African continent features a stark contrast in temperatures: Hot and dry conditions in the Sahara Desert to the north and cooler, moister conditions in the rainforests and the Gulf of Guinea to the south. Nature seeks to balance these gradients, leading to the formation of phenomena like the African Easterly Jet. As thunderstorms form over Africa in the summer, the African Easterly Jet migrates slightly north and south. This gentle movement creates small kinks in the jet stream, known as tropical waves.
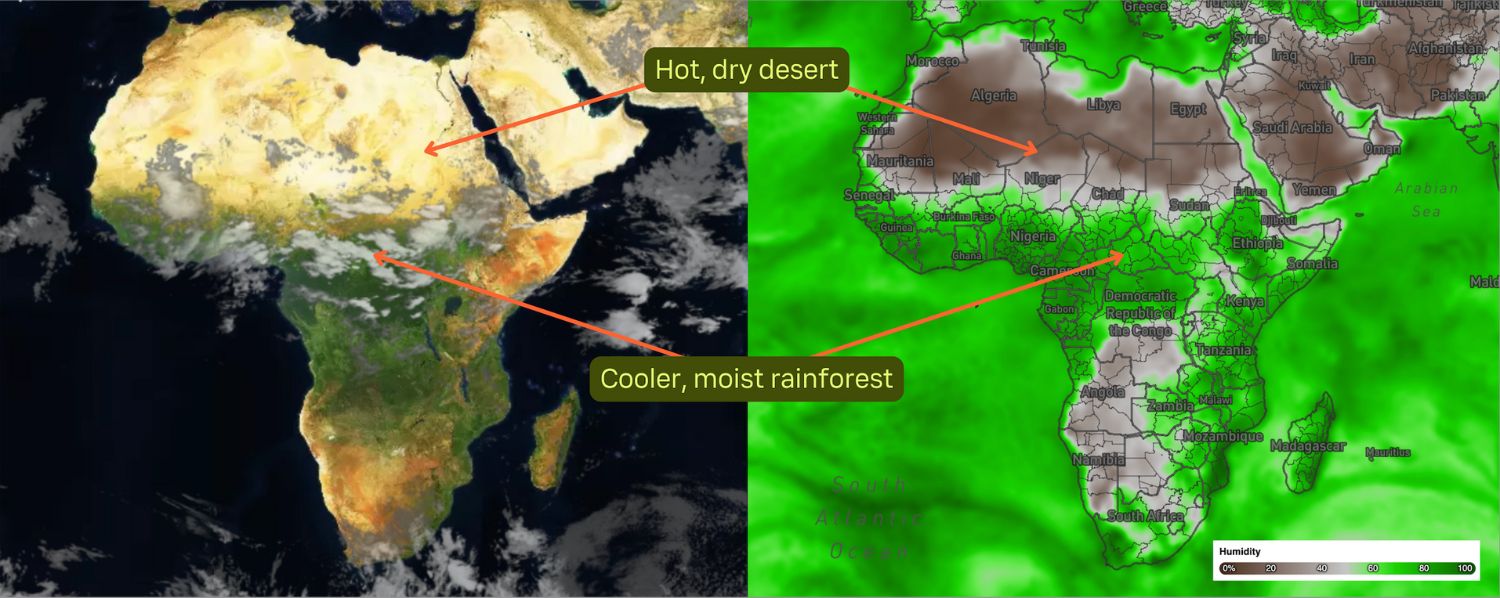
MapsGL visualization demonstrating the difference in conditions between the desert and rainforest regions of Africa
As these tropical waves move westward across the African continent and out into the ocean, their thunderstorm activity can persist, organize, and strengthen into cyclones, depending on atmospheric conditions and ocean temperatures. Annually, around 60 tropical waves traverse the Atlantic, but only about 12 strengthen into cyclones. The journey from the coast of Africa to the coast of the US typically takes one to two weeks.
Hurricane Beryl in July 2024 as it passes by Jamaica, visualized using Xweather MapsGL demos. Layers seen include sea level pressure (outlines), wind speeds, wave/swell height, and active lightning; an area of low pressure and increased wind speeds are associated with the system, along with increased wave heights
Tools and resources to prepare for an intense 2024 hurricane season
As the 2024 Atlantic Hurricane Season progresses, being aware of coastal and ocean conditions is crucial for the safety of the public and for business operations. Our goal at Vaisala Xweather is to bring together the best of science and technology so that you can be confident in the protection of your employees and make informed business decisions.
For those in the impact zone of Hurricane Beryl and others to come this season, stay safe. You can track tropical storms in real time with a free trial of our API and mapping suite or through our free MapsGL demos.
API endpoints we'd recommend for tropical storm tracking and safety — both on and off the seas :
lightning: Our suite of lightning endpoints provides the same high-quality, real-time lightning data trusted by the likes of the National Hurricane Center.
maritime: Includes globally-available storm surge and tide height visualizations – one of the first of its kind – to track storm paths and forecast increased ocean and wave heights associated with tropical events
)
)