Historical wind resource data
Fast, easy access to high-quality historical wind resource data for site selection, resource assessment, and climate impact studies.
Unlock the potential of your wind energy projects with high-quality historical wind resource data for site selection, resource assessment, and climate impact studies. Xweather supports every stage of wind energy development helping wind farm developers and operators make informed decisions to enhance project viability and success.
Wind resource time series data
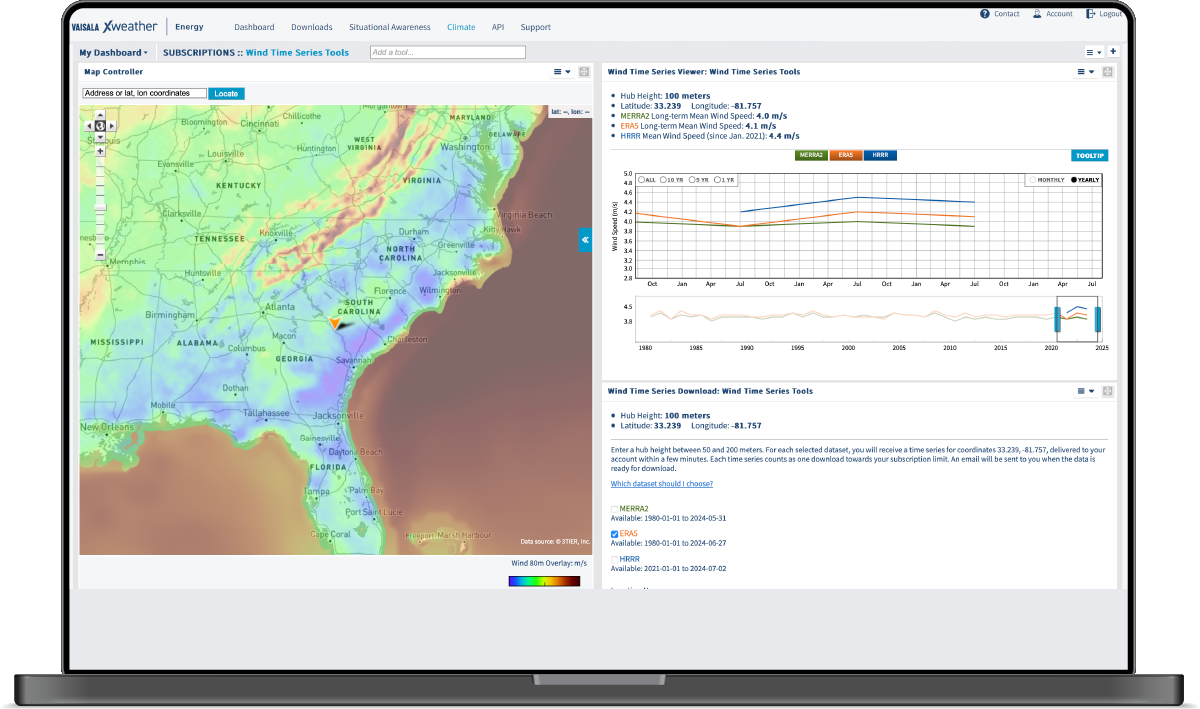
Time series data is crucial for assessing specific locations for wind energy projects, helping you understand a site's wind patterns and resource potential over time.
The Xweather wind time series tool provides a quick and convenient visualization of time series data from an ensemble of ERA5, MERRA2, and HRRR reanalysis datasets covering more than 40 years.
Xweather time series plots show monthly and annual wind speeds for any hub height between 50 and 200 meters. Data is available for any continental or near-shore location between 60° S and 70° N worldwide with 5 km resolution.


Wind prospecting tool
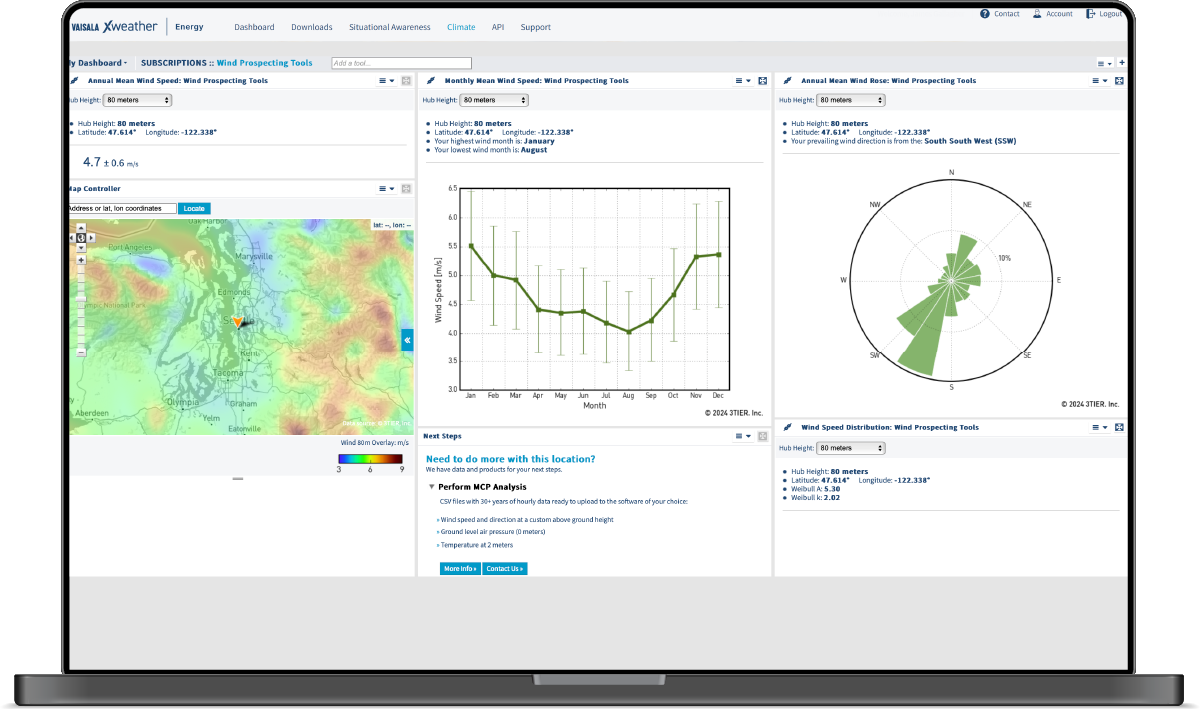
The Xweather wind prospecting tool is ideal for efficiently identifying potential development areas with high wind resources. Accessed through a global map with 5 km resolution, the tool provides instant access to 10-year annual and monthly average wind speed, wind rose, and Weibull parameters at 20, 50, and 80-meter hub heights.
The map's color scale lets you compare different regions. Warm colors indicate higher average wind speeds. Cool colors indicate lower wind speeds. For your selected location and hub height, a chart shows the mean wind speed for each month of the year and the confidence interval for each estimate.
Climate reference tool
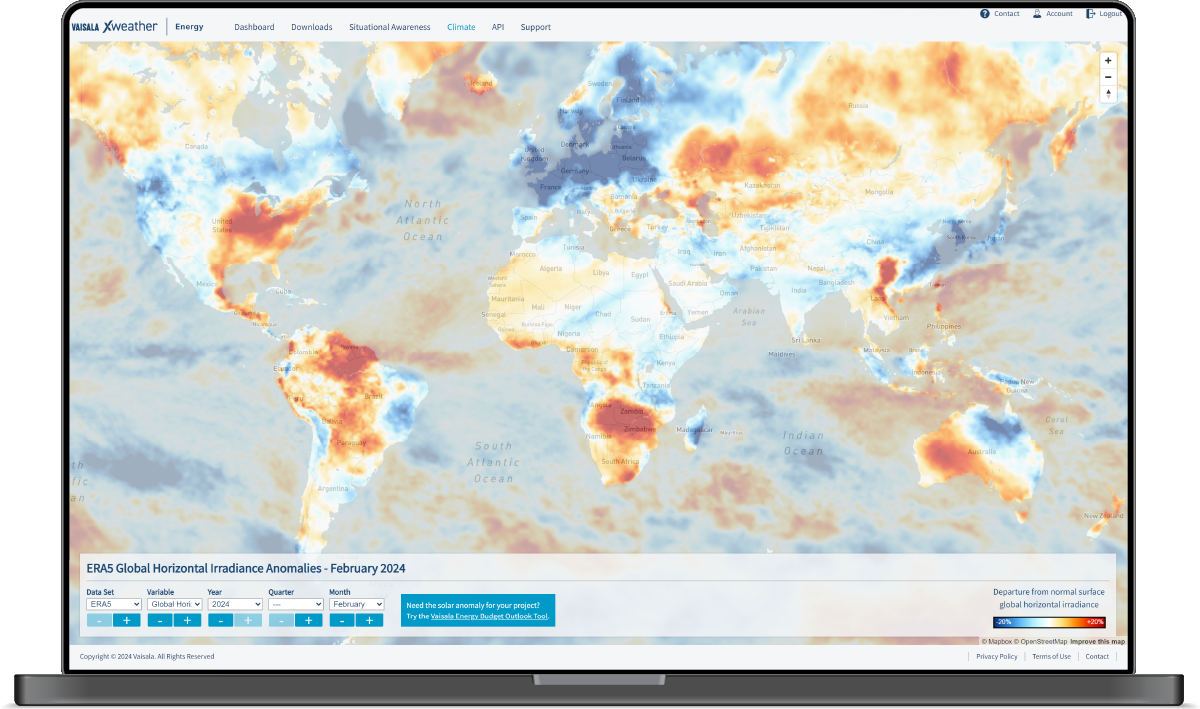
Explore over 40 years of historical wind, solar, and temperature data. The Xweather Climate Reference Tool shows departures from the long-term average for the last month, quarter, and year.
The data covers the globe and includes temperature, wind speed at 100 meters, direct normal irradiance, and global horizontal irradiance. We have over 40 years of historical data available, which you can view by month, quarter, or year.


Situational awareness tool
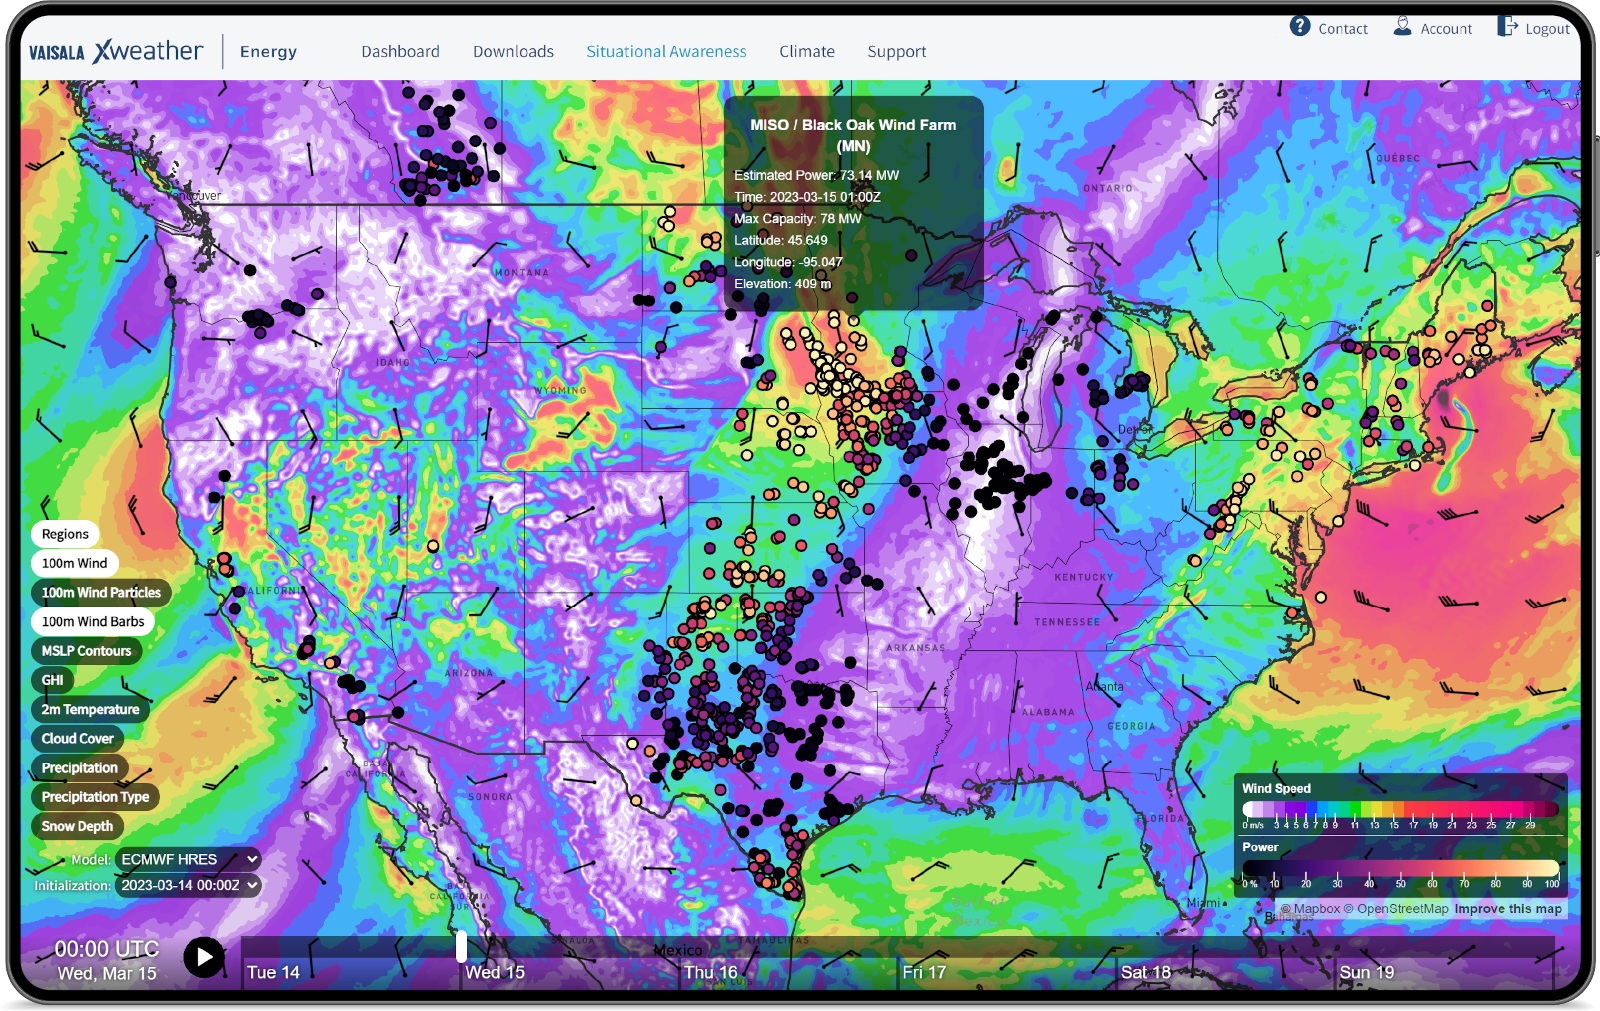
The Xweather situational awareness tool provides an animated six-day global forecast of the key weather parameters for renewable energy. Map layers include wind speed and direction at 100-meter hub height, global horizontal irradiance, ground level, cloud cover, pressure, precipitation, snow depth, and air temperature.
In the United States and parts of Canada, the tool also delivers an intuitive visualization of renewable energy production. Circles mark the location of energy projects with color indicating the project’s estimated energy output as a percentage of its nameplate capacity.
Minimize development risk
Use the most reliable, high-quality wind resource data to assess project viability while reducing uncertainty and minimizing risk.
Global coverage, local precision
Xweather provides high-resolution global coverage at multiple hub heights so you can confidently explore and compare potential sites and project configurations.
Data on demand
The Xweather wind prospecting tool provides instant access to resource maps and charts for any location. Time series plots are produced within 24 hours.
Get started today
Basic
Visualize long-term time series data from ERA5, MERRA2, and HRRR reanalysis datasets
Compare monthly and annual wind speed averages at any hub height between 50 and 200 meters
See the 10-year annual and monthly average wind speed, wind rose, and Weibull parameters at 20, 50, and 80-meter hub heights for any location
Wind prospecting maps and charts
Climate reference tool
Situational awareness tool
FAQs
What affects wind at a given site?
What is a wind resource assessment?
What makes a good wind resource?
How accurate is the wind prospecting tool?