)
:focal(1076x667:1077x668))
The image above might have you thinking we are on the verge of an ice age. In fact, this map shows variations in lightning density, which is a measure of how much lightning occurs in an area over time.
In this post for Lightning Safety Awareness Week, we'll explain why lightning density data is a valuable resource for risk assessment, site selection, operational planning, and more. Not only that, we'll also show you how to access high-quality lightning density maps for any location on Earth—for free!
What is lightning density?
There are two main ways to measure how much lightning occurs over a region:
Lightning count is simply the number of lightning events that occurred.
Lightning density is the number of lightning events that occurred per square kilometer of area.
Let's look at an example comparing lightning activity in two differently sized areas.
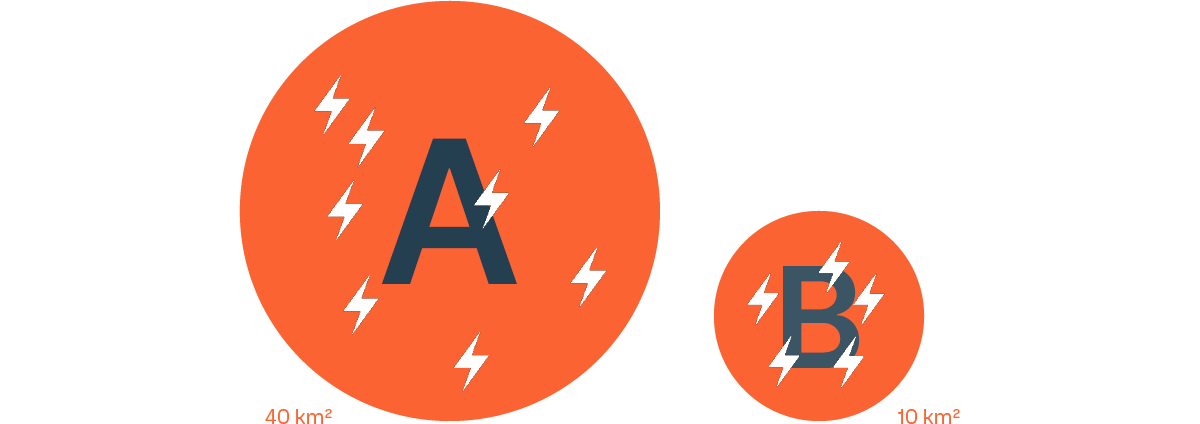
In our example, Area A has 8 lightning events, and Area B has 5 lightning events. Area A has a higher lightning count, but you might say it is only because it is four times larger than Area B.
Lightning density gives us a level playing field for comparing areas of different sizes. To calculate lightning density, we divide the number of lightning events by the area of the region:
Area A has a lightning density of 0.2 events per km2 (8 events / 40 km2 = 0.2).
Area B has a lightning density of 0.5 events per km2 (5 events / 10 km2 = 0.5).
Despite having a lower total lightning count, the risk of lightning is higher in Area B. In this example, choosing a site in Area A for your business would reduce your risk of lightning by more than 50 percent.
Turning lightning strikes into safety solutions
While lightning is certainly dangerous, the data we gather from lightning detection helps businesses create safety protocols and minimize operational disruptions. Experts use lightning density data to specify protection systems for buildings and essential infrastructure. Developers and insurance underwriters use it to assess lightning-related risks. Historical lightning density data is a key resource for safety professionals for three reasons:
Lightning density tells us how much lightning occurs over an area on average. And because it is based on historical data, it provides an empirical metric for predicting lightning too.
Calculating lightning density from many years of data evens out anomalies and exceptional events, providing a reliable baseline for financial modeling and risk assessment.
Lightning density is a consistent metric for comparing lightning risk across areas of different sizes. You can compare lightning density across countries, states, counties, or even smaller areas.
Businesses benefit from lightning density data in many ways, particularly in sectors where lightning poses a significant risk to safety and operational continuity, as we'll see in the next section.
Using lightning density data for wind farm site assessments
Wind energy developers look for sites with consistent, dependable wind resources. In the United States, some of the most attractive locations also come with a high risk of lightning.
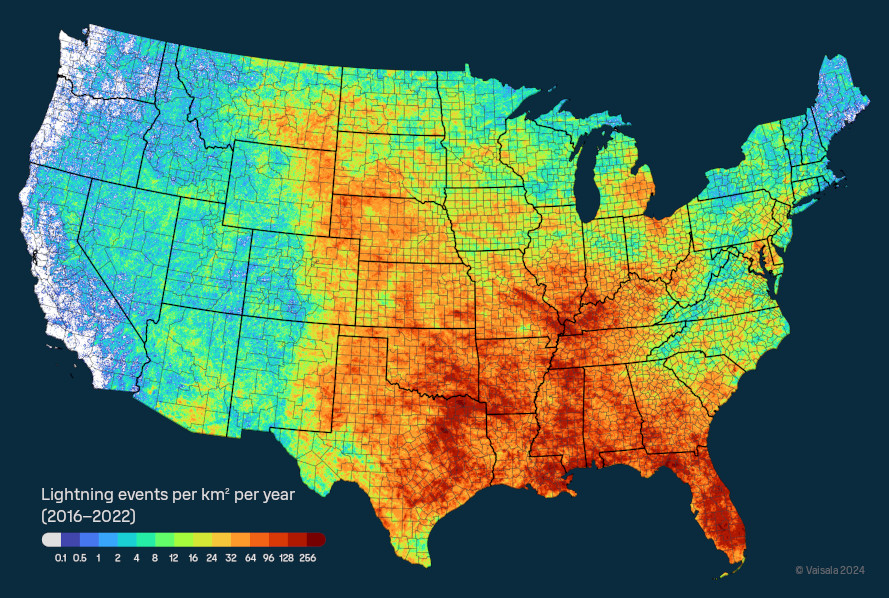
Lightning density map of the United States using data from 2016–2022.
The map above shows the average lightning density per km2 per year across the contiguous United States using data from 2016 to 2022. Lightning is more frequent in the middle of the country—where there are many wind farms—and the Gulf Coast states. Some areas in these regions see upward of 100 lightning events per km2 every year. Lightning is far less common in the Northeast and West Coast states, where the lightning density is typically measured in single figures.
Lightning struck U.S. wind farms 77,494 times in 2023.
Wind turbines are natural targets for lightning, due to their height and materials. Almost one-third of U.S. wind farms saw one or more lightning strokes per turbine in 2023. A wind farm in Pushmataha County, Oklahoma, had an average of 14.4 lightning strokes per turbine. A wind farm in Hansford County, Texas, and another straddling Blaine and Custer Counties, Oklahoma, saw more than 1,000 lightning strokes each last year.
On the positive side, 33% of U.S. wind farms got through 2023 without a single lightning strike.
What separates the wind farms that were struck from those that weren't? It all comes down to location and lightning density. If you build your wind farm in an area with high lightning density, you should account for more operational downtime along with larger expenses for insurance, inspections, maintenance, and repairs. Lightning strikes cost the wind energy industry $100 million annually and account for almost 20% of operational losses overall, according to estimates.
Every wind farm site assessment should include a meteorological analysis to identify weather patterns and severe weather risks that could affect the project's operations and economic feasibility. High-resolution lightning density data is an essential tool for assessing and comparing the lightning risk at each potential location.
Watch our on-demand webinar, "Lightning risks for the wind energy industry," for more on this topic, or check out the Vaisala Xweather Annual Lightning Report to discover the locations of the top 20 most lightning-prone U.S. wind farms in 2023.
How to access high-quality lightning density maps—for free!
The Vaisala Xweather interactive global lightning density map shows the average lightning density for every country, state, and province in the world.
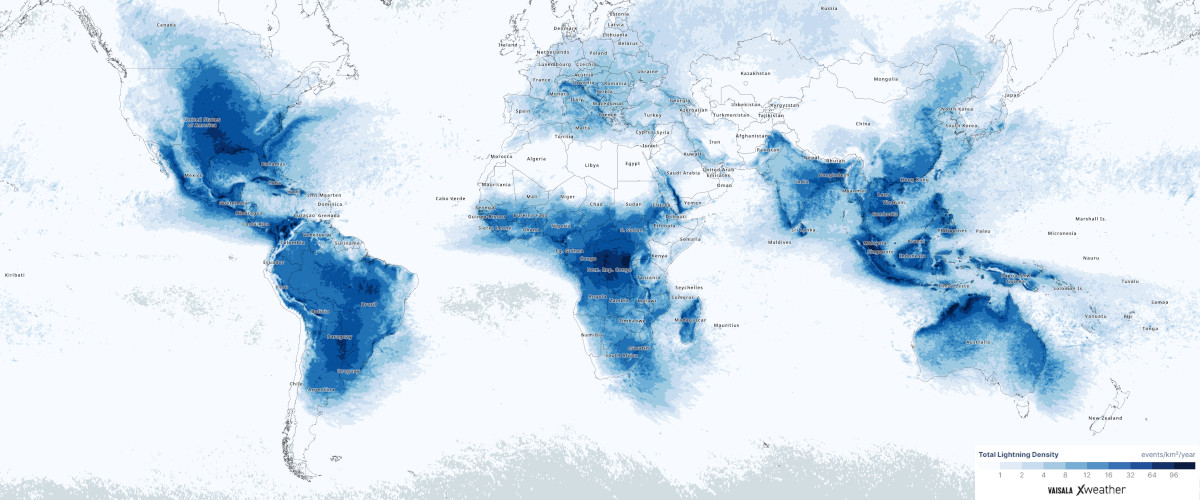
The map includes a 3D view, which gives a more realistic representation of each country's size, and a 2D view, which lets you see density data for the entire world at once. Use the map controls to switch between the Density Contour view (as in the image above) or the Land view (as in the image below).
Pan and zoom to see more detail at the state or province level. In the United States, you can also compare lightning density at the county level. Hover over an area to reveal the lightning density for that location.
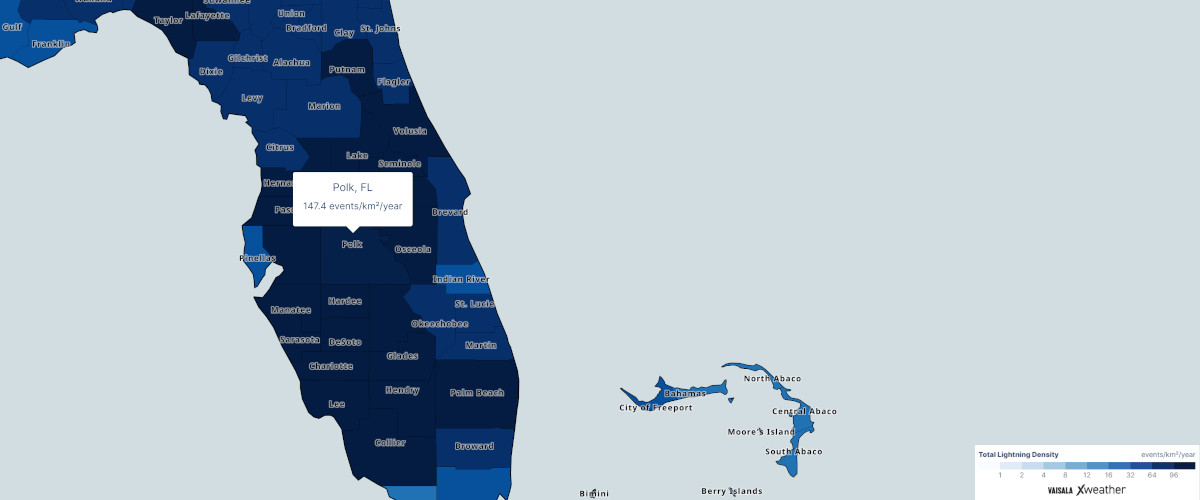
The Xweather interactive lightning density map is open to everyone and free to use. Explore the map for yourself to discover the lightning density for your country, state, or province. How does it compare with neighboring areas?
Lightning data you can rely on
The Xweather global lightning density map is powered by data from Vaisala's world-class lightning detection networks. We detect 99.9% of thunderstorms worldwide and record more than two billion lightning events every year. This is 5–10 times more than any other network or technology, which is why Vaisala Xweather is the primary source of lightning data for the National Weather Service, the Federal Aviation Administration, the U.S. Air Force, the U.S. Navy, and many more companies and organizations.
If you need high-resolution historical lightning density data for site selections, risk assessments, or other safety needs, get in touch today, and let us put our expertise to work for you.
)
)
)