)
)
The /stormcells endpoint provides information on individual storm cells across the United States, including Puerto Rico and Guam. Storm cell information is a radar-derived product that identifies and tracks storm movement. Cell intensity and severe weather signatures within the cell, such as rotation and hail, are also reported. The forecast track can be obtained as a polygon cone or a line when available.
The endpoint provides the following information:
Storm location
Storm direction, speed, and forecast
Hail potential and size
Storm showing a tornadic signature
Cell with significant rotation
Precipitation rate
Cloud heights
While the weather API provides valuable data about storms and severe weather, plotting them on a map tells a better story for particular events. Raster maps offer many options for creating storm cell visuals.
Storm cell layer
With Xweather's raster maps, you can use the stormcells layer to easily overlay storm cells onto static maps or use them as tiles with any third-party mapping library.
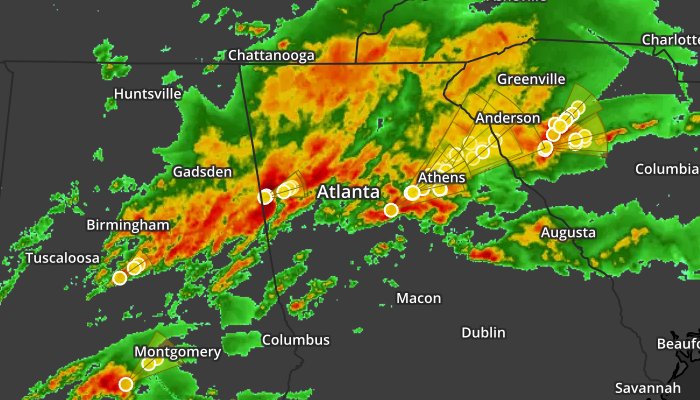
For example, here's a static map with radar and storm cells centered on Atlanta, GA, at zoom level 8:
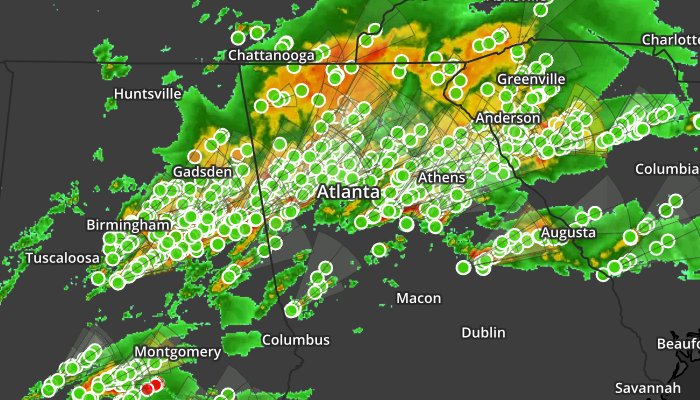
In this example, we plot all available cells — even general storms that indicate no significant threats other than light to moderate rainfall.
Xweather's raster maps allow you to filter the storm cells to show only those cells with potential threats, such as hail, significant rotation, and tornadic signatures. Adjust the layer name from stormcells to stormcells-major:
Likewise, you can replace -major with -hail, -rotating, or -tornado to further filter the cells displayed. For example, below, we use the above example filtered for hail-related cells only:
Storm cells using interactive maps
You'll find more examples of customization for storm report visuals in our documentation, including an example detailing how to add storm cells as point data instead of a static image overlay. The following code provides an example map with cells displayed as individual markers.
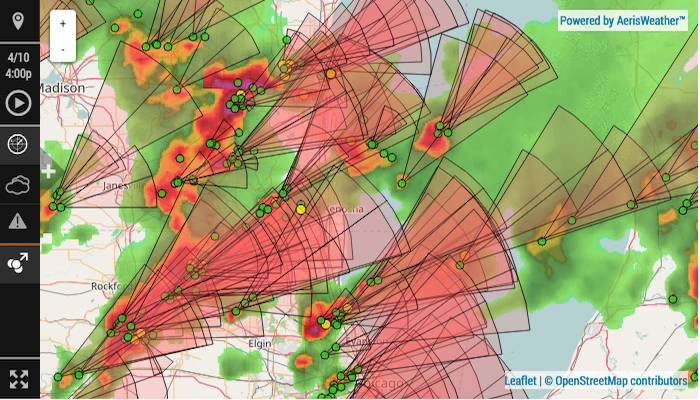
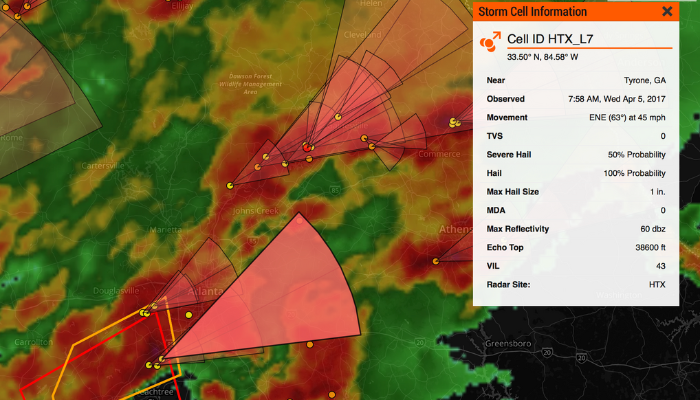
Using a mapping library, using storm cells as point data allows you to add interaction to your cells, such as clicking or tapping on a cell's marker on the map to display more details about that cell. You can also ask for a list of major cities currently in the forecast path of a particular cell.
Storm cells using a Leaflet map
Leaflet.js is a commonly used open-source mapping library. Integrating storm cells with a Leaflet map is simplified since the Xweather API supports outputting data in GeoJSON. GeoJSON is a standard method for transferring geospatial data between systems and is supported by many modern mapping platforms, including Leaflet.
When adding storm cells to a Leaflet map, an API query similar to the following could be used:
The above URL would fetch up to 1000 storm cells across the US. If mapping storm cells isn't your goal, querying the data directly using the weather API also has many practical purposes for custom applications.
Nearby storm cells
The API will return the 10 closest cells within a 25-mile radius if you pass a location to the storm cells endpoint:
The API will return "no data available" if no storm cells are found within 25 miles of the location. The location can be a city, state, US zip code, coordinates, or other supported place formats.
To extend the radius of the search to 50 miles, we can add radius=50miles to the query:
Distance from storm cells
The relativeTo JSON object for each storm cell result provides the bearing from the requested location and the distance:
This information, combined with the cell's direction and speed, is beneficial for determining if the cell is approaching the location and how long it may take for the storm to arrive.
Filtering storm cells
When requesting storm cell data, the API will default return information on any cell. This includes general storms that may not indicate significant weather threats. The /stormcells endpoint provides a variety of filters to limit results.
For example, to limit the result to just storm cells with hail:
Or, limit to cells with intense rainfall:
Filters can also be combined, such as returning results that include hail and intense rain.
Along with filters, the storm cells endpoint offers a variety of query options that can be used to limit results further. For example, find the 10 closest storm cells with a high probability of hail with a diameter 1" or greater:
We can also sort the results by potential hail size, largest to smallest, using sort parameters:
Searching storm cells
One unique feature of the Xweather API is the search action, which allows you to perform advanced queries that may not pertain to a specific location. When used with the storm cells endpoint, you can search the entire US, a single state, or multiple.
For example, return up to 100 storm cells that indicate a tornadic vortex signature (TVS) (if there are more than 100 cells with a tornadic signature at a given time, we may have bigger problems):
Or, return up to 100 storm cells within the state of Minnesota that have a diameter estimated to be 1.5" or greater in size, sorted by hail size:
Locations within a storm cell's path
Storms usually provide forecast path data. At this point, the API will also give a forecast cone to indicate the potentially affected locations. Using the affects action with the /stormcells endpoint, you can obtain a list of the cities within an individual cell's forecast.
A unique id is provided with each storm cell response, which will look similar to DXY_B4. When you query the affects action, use the id of the cell you wish to query, and the API will return a list of cities within the storm's forecast cone. Only cities with a population of 25,000 or more are returned by default:
The above request would return the top 10 locations, by population, within the forecast path of the storm cell with an id of DYX_B4.
If you would like to return locations with a minimum population of 1,000, then you can add query=pop:1000 :
Start tracking storm cells
We’ve reviewed the many capabilities of the storm cells endpoint — from static maps and interactive maps to querying the raw data directly. Get started with our free Developer Trial to experiment with integrating storm cell information into your applications and alerting platforms today.
)