Leaflet is the leading open-source JavaScript interactive maps library. This lightweight dependency takes advantage of the powerful OpenStreetMap basemap and supports both standard geocoded raster and vector imagery, as well as WMS tile layers.
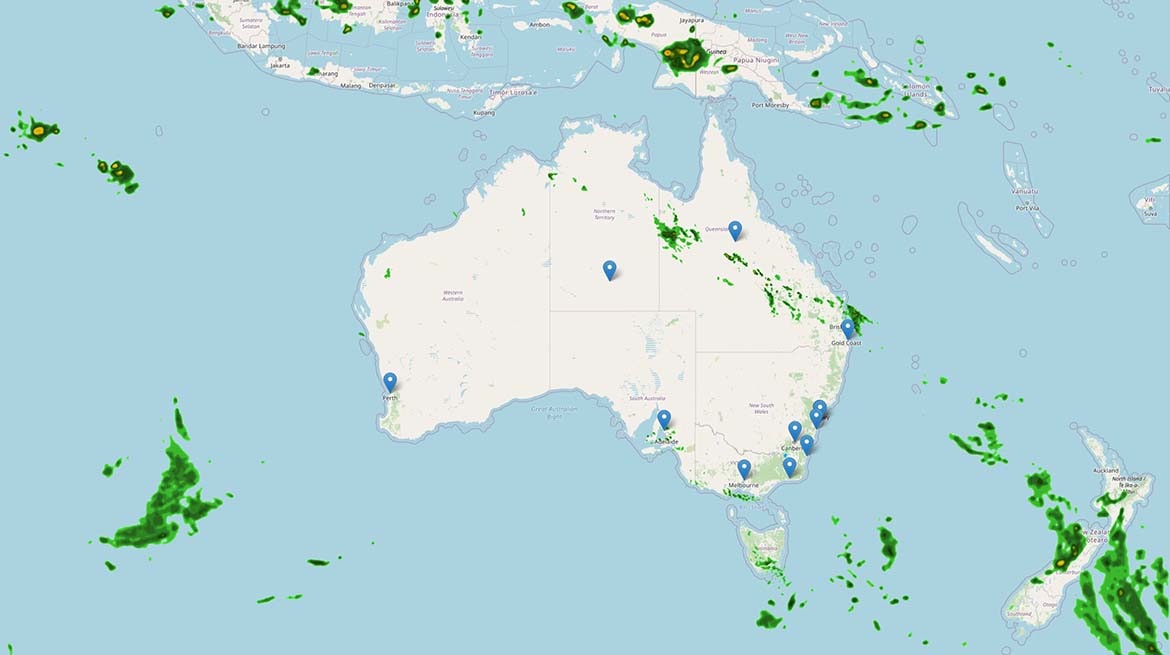
In this tutorial, we’ll walk through integrating Xweather Maps with Leaflet’s tile mapping library to create weather maps that display radar alongside various locations of importance to track incoming storms. At the end of the tutorial, we’ll summarize the code for easy modification.
Getting started – CSS and Leaflet libraries
Within the header tags of our document, we will need to incorporate basic CSS to style our map and force it to occupy the full width of its container. We’ll also need to load our Leaflet libraries and stylesheet:
Place and configure your map
Let’s move into the body content of the target site or application. To place your map within a container or on a page, denote your map’s location in the destination app or webpage by copy-pasting the below div tag into your site:
Now let’s incorporate our basic script and start setting attributes for our map. In script tags, let’s begin by specifying some locations for map pins (via GPS coordinates), defining our total intervals (the number of frames you want your animation to include) and time offset (how far in the past you want your animation to begin):
The above will require you to fill in values with your unique CLIENT_ID and CLIENT_SECRET from your Xweather account dashboard. These spaces have been denoted in the code. If your clients use slow internet connections or 3G bandwidth or slower in the field, NUM_COLORS is set to 256 to improve imagery load times. You can set this as blank for applications where a fast and reliable internet connection is guaranteed.
Now let’s add a map layer! You can add as many as you like, but we’ll utilize global radar for the purpose of this project.
Here comes the fun part - Constructing our URL to request Xweather Maps’ tile layers and instructing it to request from multiple servers simultaneously:
Render your map and pins
Let’s render our map and generate those pins we added coordinates for to highlight locations we care about – after all, one of the best parts of Leaflet is all of the extra features available to include within your maps. The following code block contains editable constants to denote different wait times to give data time to load before trying to render it, as well as step times to define how long to wait between each animated frame. These constants are clearly named in the code example. Feel free to adjust these as needed depending on your network performance and business needs.
An easy integration
If you noticed the </script> tag in the previous code block, that’s because we’re done! You can view a functioning embed of this code - without the pins - on the Leaflet example page.
Leaflet’s ability to work in tandem with both Xweather's Maps and API underscores its ease of use in business settings. With no authorization token or account to manage on the Leaflet side, it’s obvious why many developers flock to it to neatly represent geospatial data. Interested in this solution or similar weather map-making solutions utilizing Mapbox or Google Maps? Try Flex free for 30 days or contact our sales team to discuss your unique needs.
As promised, the full code block sits below. Happy coding!
