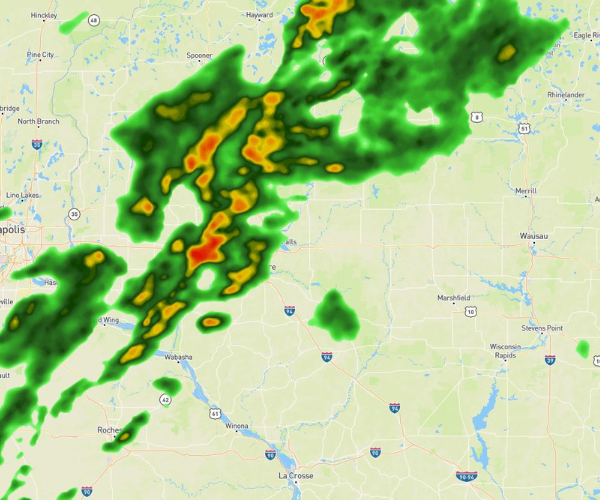
One of the most challenging elements of utilizing large volumes of weather data for business can be performance. With weather as an input to nearly every industry in some regard, the importance of consistent, fast data retrieval and rendering is paramount. Loading high-resolution and layered imagery inefficiently can dramatically interrupt the smoothness of utilizing interactive and animated map elements within any application, online or otherwise. Fortunately for Xweather users, one can call upon multiple tile servers working in unison to dramatically increase render speed.
Many customers already have integrations with third-party mapping platforms like Google, Mapbox, or Leaflet, so in this example we’ll walk through how to enable multi-tile server map animation in conjunction with a Google Maps instance. The below sections explain the code line by line, but if you are looking to jump ahead, you’ll find the full length of code at the end of this tutorial.
Getting started – Google Maps key + CSS
The first step to getting started is to ensure you have a Google Maps API key or create a new one. To create your own, sign up for a Google Cloud account and verify your email. Be sure to restrict your API key’s usage via the Google Cloud Console before sending your project live for added security.
The next step is to add CSS to style your map into the <head>. Below is a basic snippet that creates a full-width map within its container:
Now place the container, ensuring you are working in the <body> tags of your HTML file:
Render the Google Map and Integrate AerisWeather Mapping Platform (AMP):
In this step, we will render the AerisWeather mapping layers we’d like to animate to display the movement and change within weather patterns and events. You’ll need to create an AerisWeather account if you have not already and gather or generate new keys under the “Apps” tab of your account.
Next, we need to set the parameters of our animation. Use frameCount to define the number of intervals in your animation and startMinutes to define the number of minutes back in time for your animation to start from, using negative values to denote the past.
endMinutes allows you to define the time offset of the final interval, with 0 being the current hour and minute. Note that the default number of intervals is 10 and animation playback speed is 2 seconds. If you simply define a start and end time, the mapping platform will automatically calculate the frames between those times and as closely match those to the tiles and times we have available in our database.
The below snippet pulls in our Xweather credentials and the raster layers we want to animate:
Adding a little direction for the construction of our URL string. No inputs or further code needed below; we’ve done the concatenation work for you.
Xweather, fetch [My Tiles]!
We are now ready to begin rendering our Google Map! We initialize our map and layers within an event handler once everything on the page has loaded, including the Google Maps library we'll be referencing. First, we set up the map instance and then grab our map tiles for each interval and giving them time to load before starting the animation. Once more, just breaking down the functions:
After this, you’re safe to close your script tags. The final step is to let Google know you’re legitimate by inserting your Google Maps API key as a parameter in the query string in <script> tags directly below. Voila, you’re done!
As promised, below is the full code block with a few additional comments:
There you have it: Faster weather maps, animatable in any direction throughout time. If you have further questions or you're interested in specific tutorials, reach out to our team to provide feedback — we’re always excited to share new and interesting ways of using the Xweather API and raster maps.